7.4 Student Profile
The Student Profile is your single source of truth for everything about an individual student their personal info, academic goals, score progression, skill-level performance, behavioural patterns, time usage, full test history, and accommodation settings.
This continuation walks through every tab in the profile, what each section means, and how to use the data to drive better tutoring decisions.
Opening a Student Profile from a program
You can open a student's profile in two ways:
From People → Students - the global list of all enrolled students across all programs.
From the program sidebar → Students - the program-scoped list (shown below), which adds program-specific columns like License details, Assigned On, Valid till, Status, and Credit Limit.
Click on any student's name in either list to open their profile.
Profile header - the always-visible summary
Every tab in the Student Profile shares the same header. It surfaces the most important context at a glance.
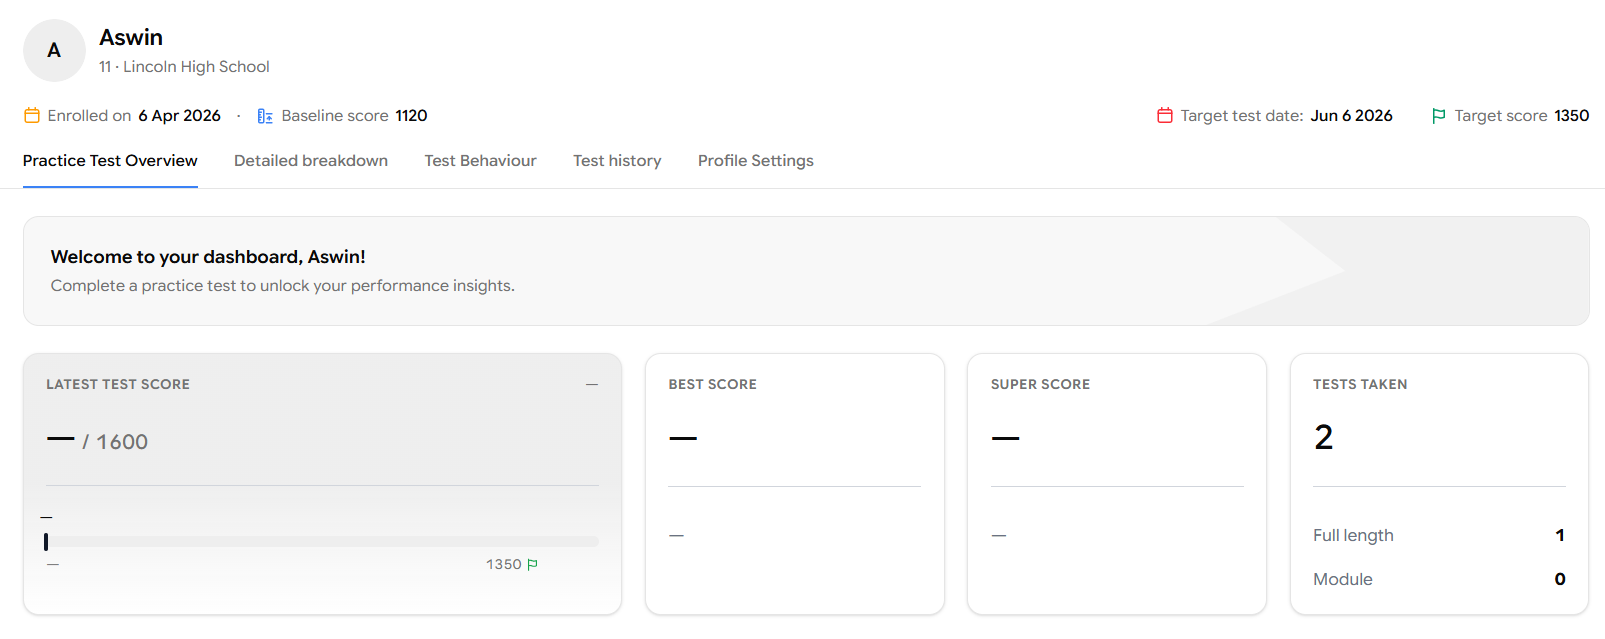
The header shows the student's name their grade and school, the date they were enrolled, their baseline score, their target test date, and their target score. These values come from the Profile Settings tab (covered later), and they power almost every chart and milestone calculation across the profile so filling them in early matters.
The profile is organised into five tabs: Practice Test Overview, Detailed breakdown, Test Behaviour, Test history, and Profile Settings. Let's walk through each one.
Tab 1 - Practice Test Overview
This is where you understand the student's latest test score against the target score they've set, along with their best score, super score, and the tests they've taken so far.
Four cards summarise the student's scoring performance:
Latest Test Score - the most recent practice test result (out of 1600 for SAT). The horizontal bar visualises where they currently sit relative to their target (the green flag at 1350 in this example).
Best Score - The overall best test score across all the tests the student has taken.
Super Score - The student's best Reading & Writing score and best Math score across all tests, combined into a single composite. This reflects what they're capable of when each section goes their way.
Tests Taken - The total number of practice tests completed, broken down into Full length and Module tests.
Super Score is often higher than Best Score because it pulls the strongest section performances from different attempts. Use it to show students what they're capable of but anchor goals on Best Score, since that's what they've actually achieved in a single sitting.
Score progression
The Score Progression chart is a separate panel below the score cards. It plots the student's scores across all their tests in chronological order, so you can see how performance is trending over time.
If the student hasn't completed a practice test yet, you'll see an empty state inviting them to take their first test. Once attempts start coming in, this chart becomes one of the most useful storytelling tools you have pull it up in sessions to show students or parents exactly how preparation is paying off.
Skill Snapshot
The Skill Snapshot helps you understand the student's strongest skills and the skills they need to work on.
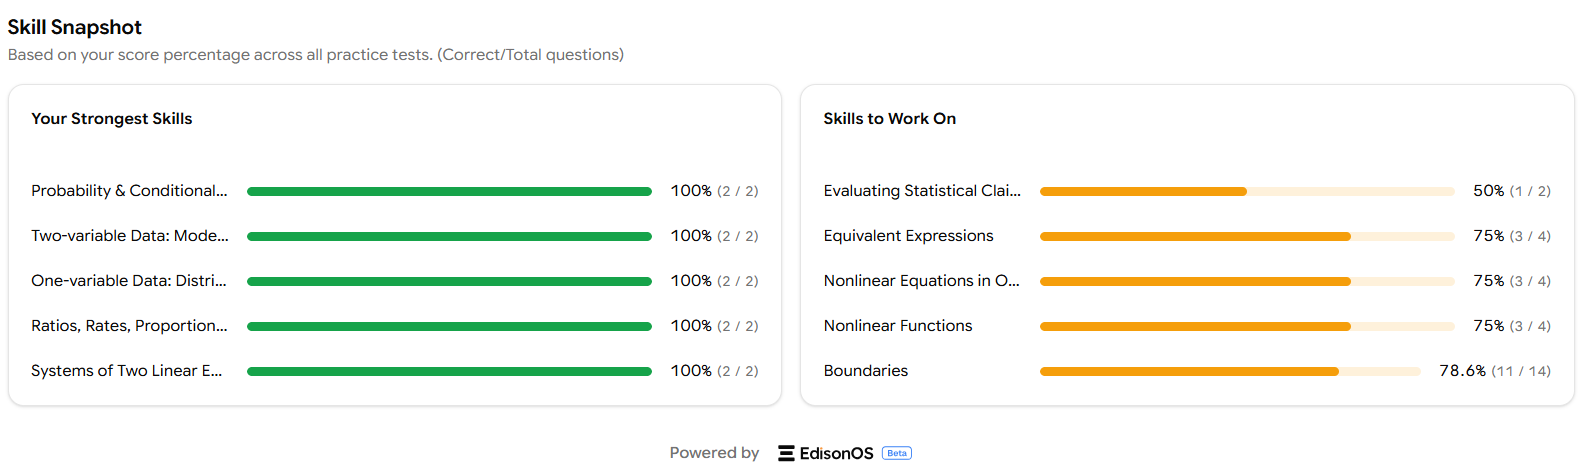
The panel splits into two columns:
Your Strongest Skills - the top skills based on score percentage (correct ÷ total questions), shown in green.
Skills to Work On - the weakest skills, ordered from weakest upward, shown in orange.
Each row shows the skill name, a horizontal progress bar, the percentage, and the raw correct/total counts.
Turn Skills to Work On into Problem Sets
The "Skills to Work On" column is essentially your next-session agenda. Pick the top one or two skills from this list and assign a Problem Set targeting them that way, every weak area gets focused practice between sessions.
Tab 2 - Detailed breakdown
The Detailed Breakdown tab is where you go for the granular numbers behind the headline scores.
Choose the assessment type
At the top of the tab, a dropdown lets you switch between Practice Test and Problem Set views. Pick the one whose performance you want to analyse and everything below the dropdown updates accordingly.
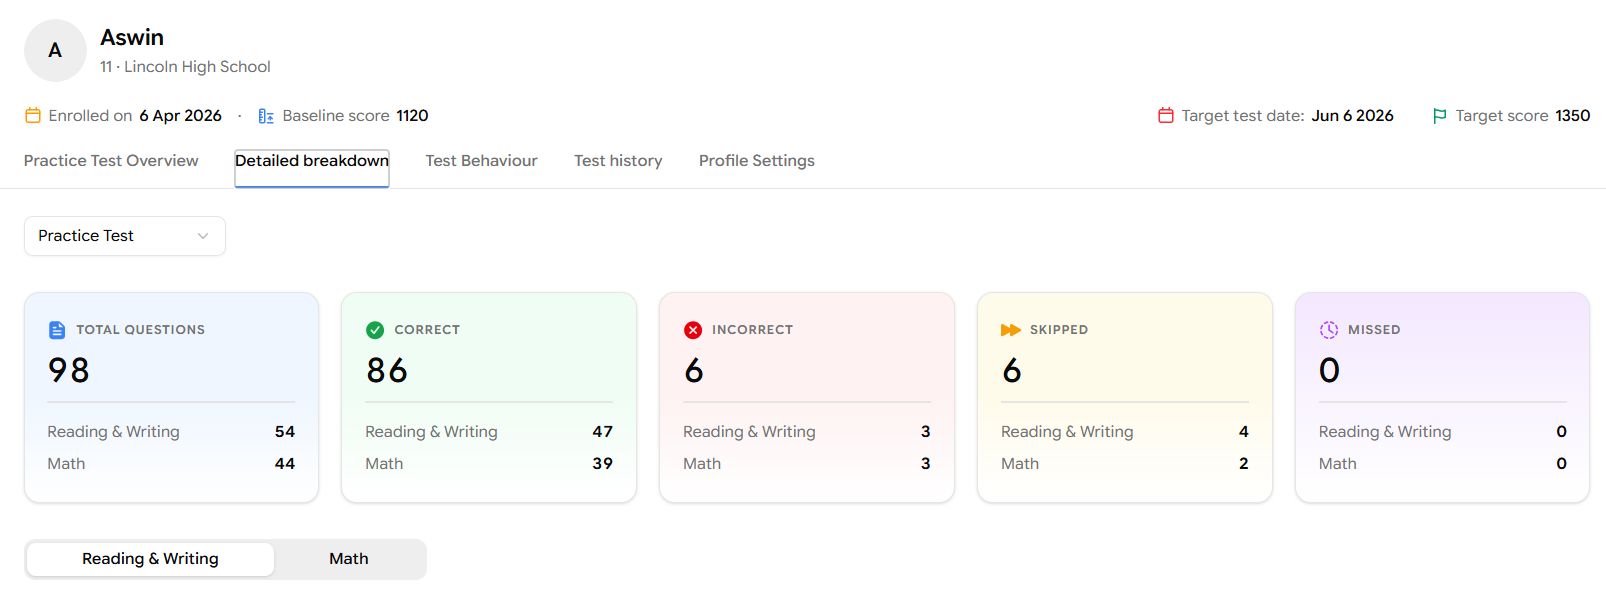
The five summary cards show the student's question-level performance:
Total Questions - how many questions they faced.
Correct - how many they got right.
Incorrect - how many they got wrong.
Skipped - how many they intentionally skipped.
Missed - how many they ran out of time on.
Each card breaks the count down by Reading & Writing and Math, so you can immediately spot whether the issue is concentrated in one section.
Skill Breakdown
Below the summary cards, you'll see a Reading & Writing / Math toggle. Whichever section you select, the Domain Breakdown table updates to show that section's Skills.
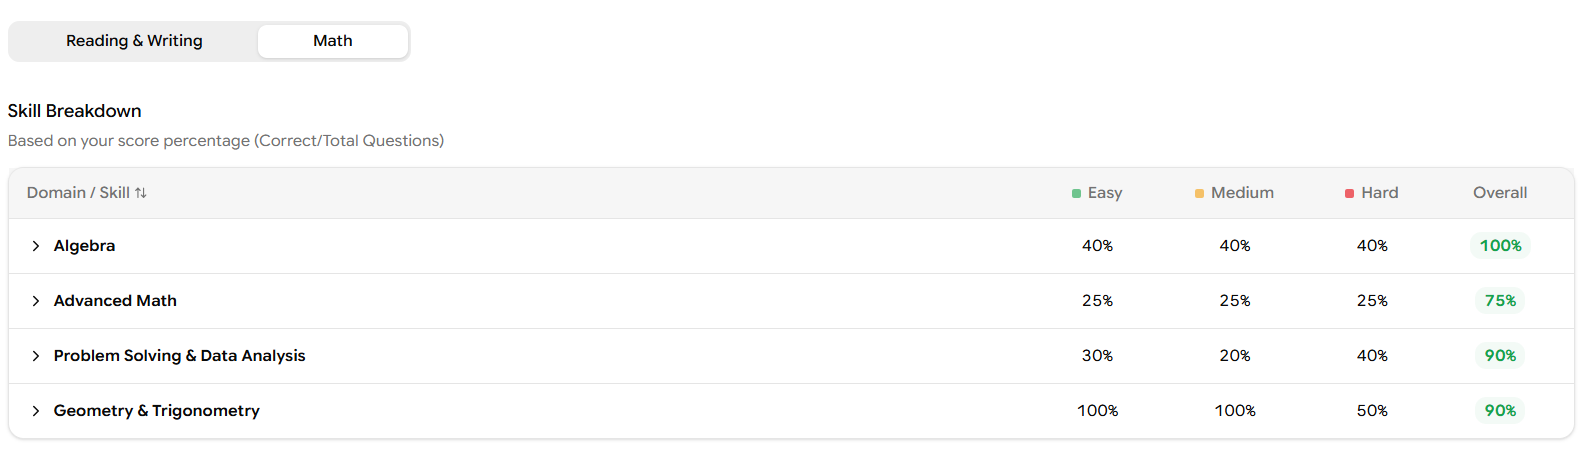
The table is a reports-style view of skill performance. Each row is a domain (Algebra, Advanced Math, Problem Solving & Data Analysis, etc.,) and each column shows accuracy at a different difficulty level - Easy, Medium, Hard plus an Overall column.
This view answers the question: Where is the student strong, and at what difficulty does performance start to slip?
Sub-skill Breakdown
Below the Sub-Skill Breakdown is a Skill Breakdown the same structure, drilled one level deeper.
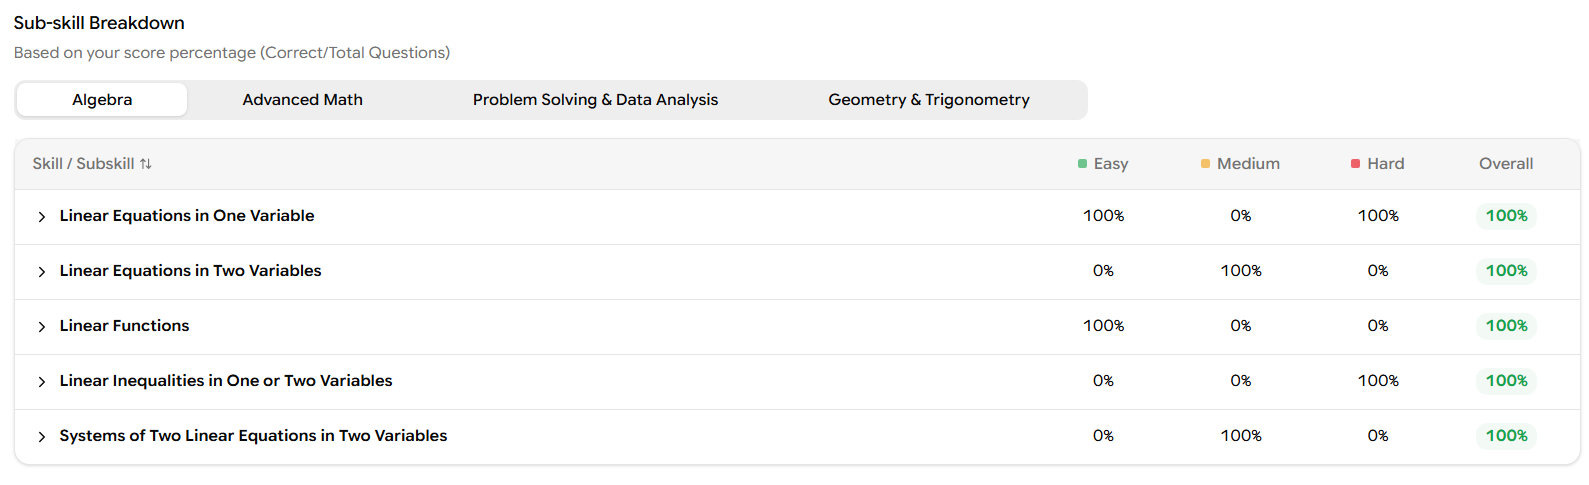
Use the tabs at the top (Algebra, Advanced Math, Problem Solving & Data Analysis, Geometry & Trigonometry) to switch which domain's sub-skills you're looking at. Each sub-skill row again shows accuracy by Easy / Medium / Hard / Overall.
This is the most actionable view in the profile instead of telling a student "you need to work on Algebra," you can say "you need to work on Linear Inequalities in One or Two Variables, specifically the medium-difficulty ones."
Tool Usage and Reference Sheet Usage
At the bottom of the Detailed Breakdown, two more tables show how the student is using the tools available to them during a test.
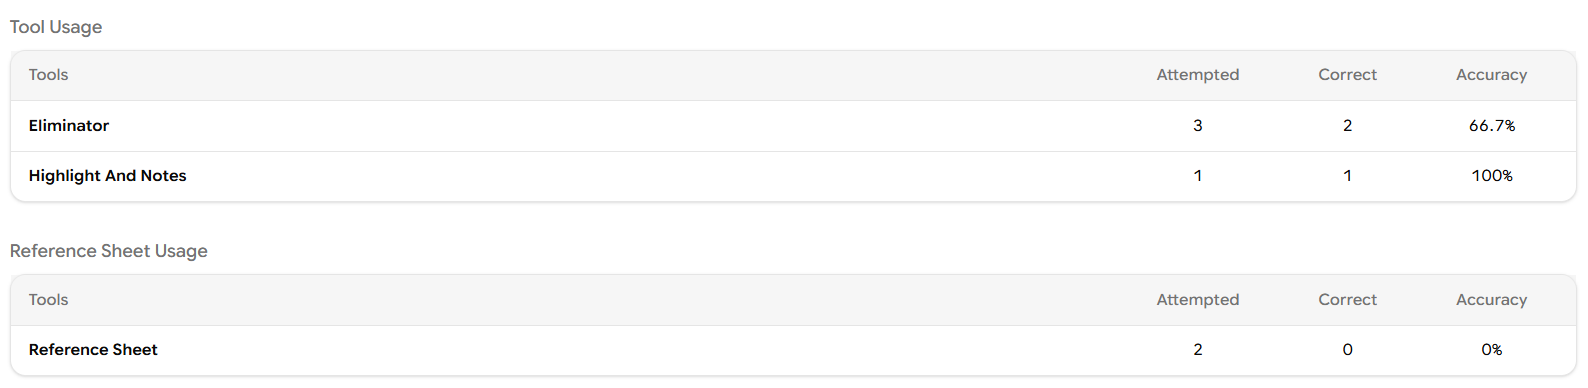
Tool Usage - tracks how often the student used the Eliminator (cross out wrong answer choices) and Highlight & Notes features, along with how accurate they were on questions where those tools were used.
Reference Sheet Usage - tracks how often the student opened the reference sheet and how accurate they were on those questions.
If a student is using Eliminator on hard questions but getting them wrong, they may be misusing the strategy or guessing after eliminating. If they're rarely using it on hard questions at all, that's a coaching moment Eliminator on hard questions usually lifts accuracy. Same logic applies to the Reference Sheet on Math
Tab 3 - Test Behaviour
The Test Behaviour tab focuses less on what the student got right or wrong and more on how they got there answer-change patterns, pacing, and overall engagement.
Answer-change matrix
At the top, five cards break down every question the student attempted by what happened on it: did they get it right on the first try, change a wrong answer to a right one, or change a right answer to a wrong one?
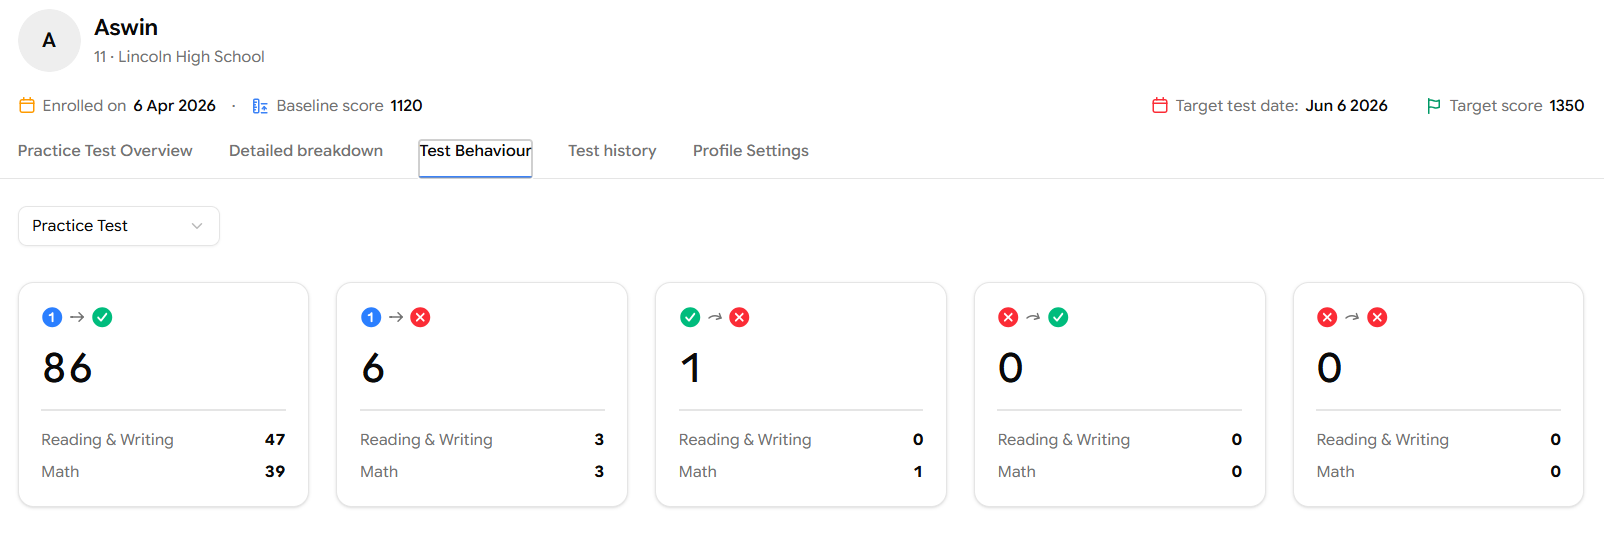
Reading the icons:
1 → ✓ - Got it right on the first attempt and didn't change the answer.
1 → ✗ - Got it wrong on the first attempt and didn't change the answer.
✓ → ✗ - Had the right answer, changed it, and ended up wrong. These are the painful ones.
✗ → ✓ - Had the wrong answer, changed it, and ended up right. Good instincts on review.
✗ → ✗ - Had a wrong answer, changed it, and was still wrong. Unsure across multiple options.
Students who frequently change correct answers to wrong ones usually have a confidence or strategy issue, not a content issue. The fix is rarely "study more"; it's "trust your first instinct unless you have a concrete reason to switch." Use this card in conversation with the student.
Time Breakdown by Difficulty
Below the matrix, three cards show the average time the student spends per question at each difficulty level - Easy, Medium and Hard are broken down by Reading & Writing and Math.
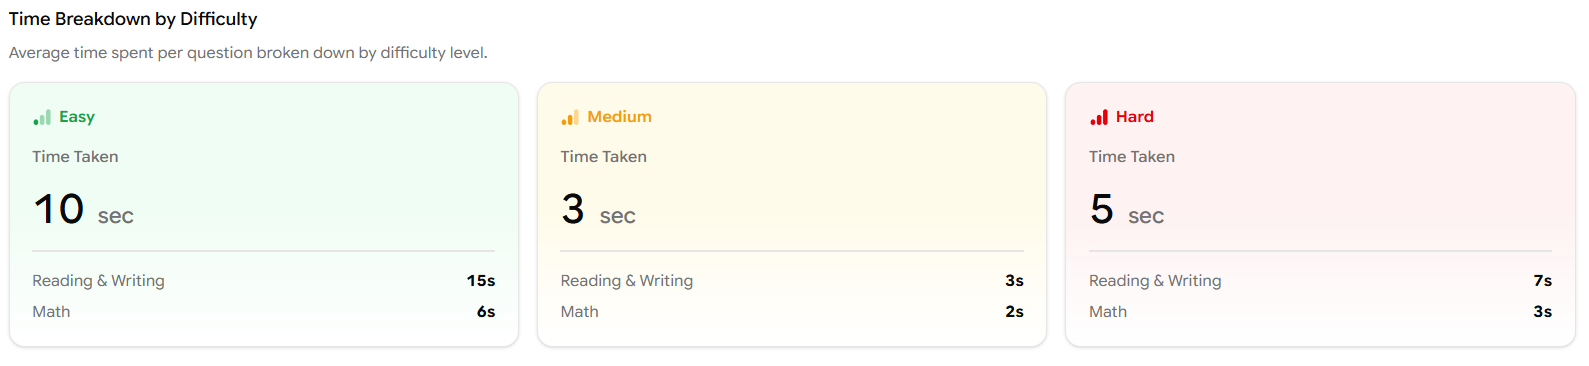
These numbers tell you whether the student is pacing appropriately. A student who spends more time on Easy questions than Hard ones, for example, is almost certainly second-guessing themselves on questions they actually know.
Engagement & Activity
Further down, the Engagement & Activity panel tracks how consistently the student shows up to practice.
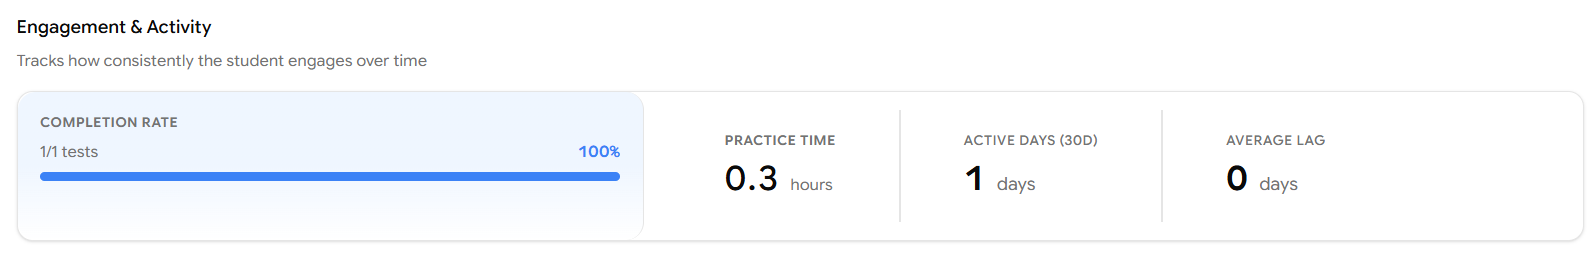
The metrics are:
Completion Rate - share of assigned tests the student has actually finished.
Practice Time - total hours spent practicing.
Active Days (30D) - number of days in the last 30 days the student logged in and practiced.
Average Lag - average gap (in days) between when work is assigned and when it's completed.
Performance by Time
The last panel on this tab is a histogram that buckets each question by how long the student spent on it (0–10s, 11–40s, 41–90s, 91–150s, 150s+) and pairs it with a Pacing Analysis Guide.
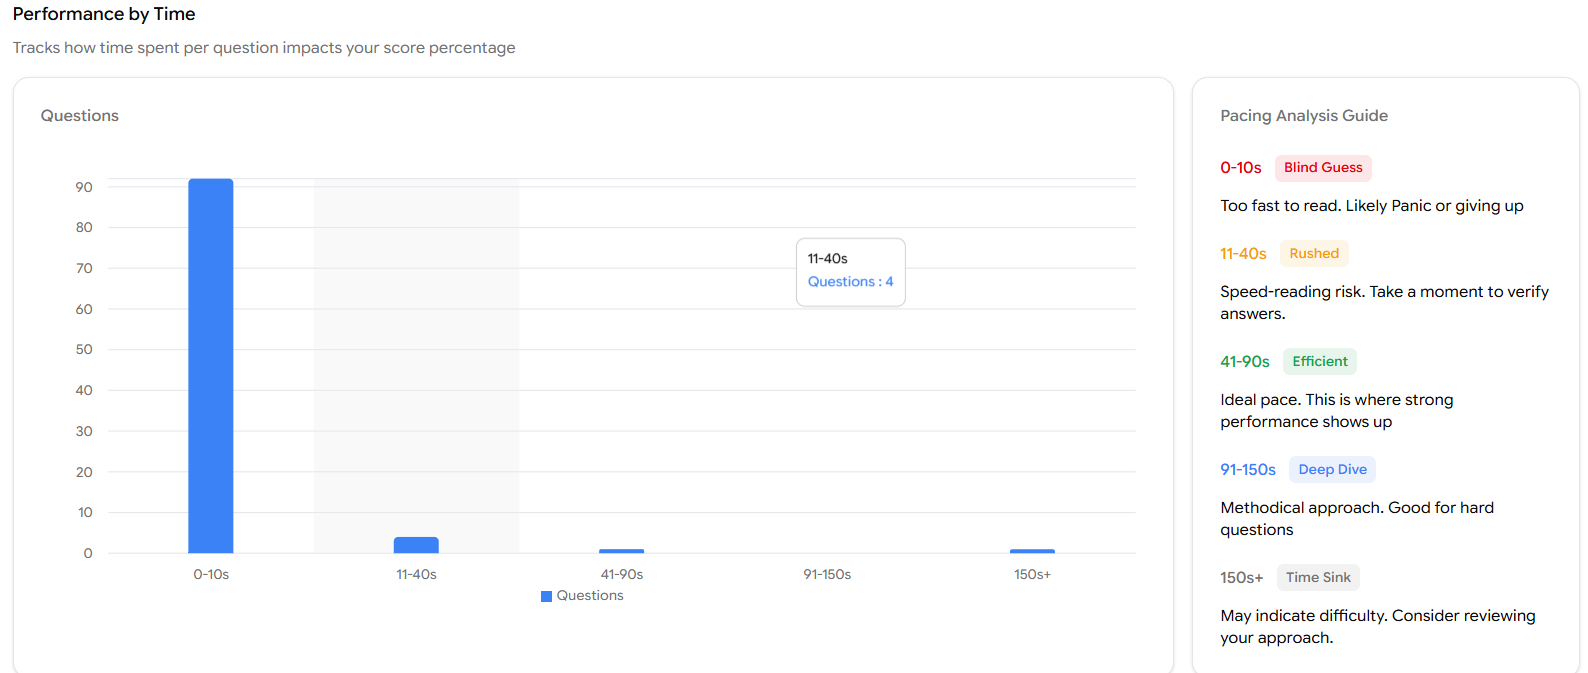
A bar that's heavily skewed to 0–10s is a red flag
If most of the student's questions are landing in the Blind Guess bucket, they're not reading the questions properly usually because they panicked on time or gave up on a section. Compare this against their accuracy: if 0–10s questions are also mostly wrong, this is the single highest-leverage thing to coach next.
Tab 4 - Test history
The Test history tab is the audit log of every test the student has attempted.
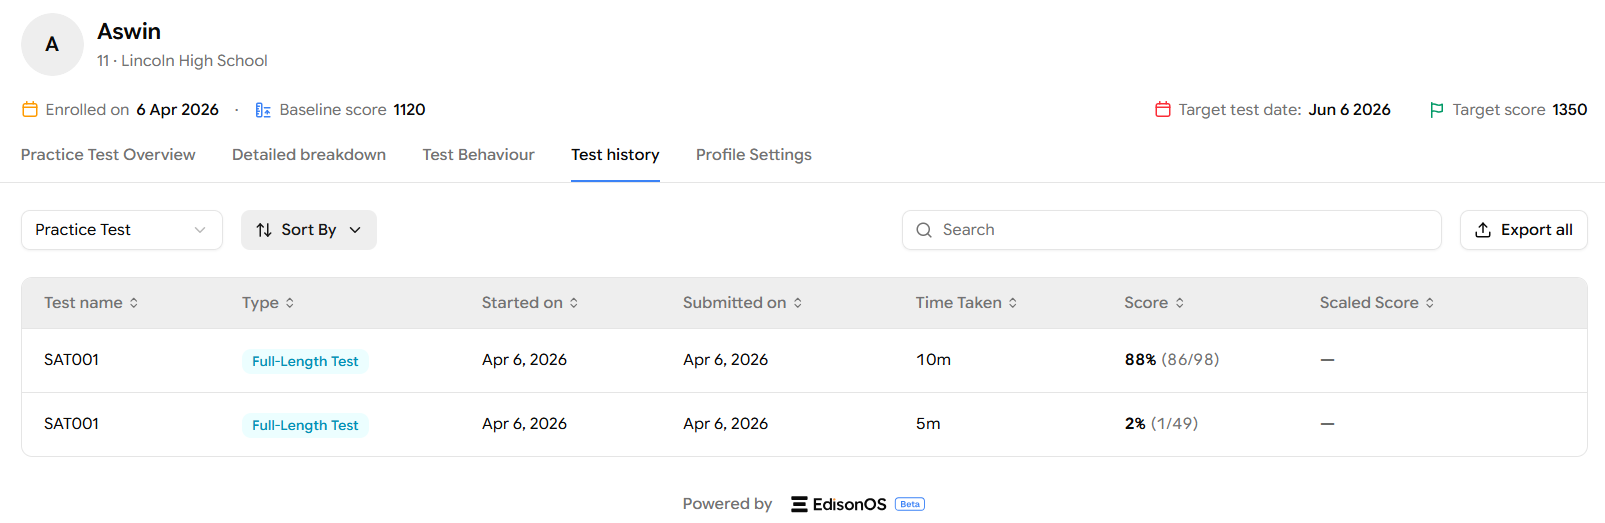
At the top, you'll find:
A Practice Test / Problem Set dropdown to filter the list.
Sort By to reorder by date, score, etc.
A Search bar to find a specific test by name.
Export all to download the full history.
Each row in the table shows the test name, type (Full-Length Test or Module Test), the date it was started, the date it was submitted, the time taken, the raw score (with correct/total), and the Scaled Score if applicable.
This view is useful when you're preparing for a one-on-one session and want to know which tests to talk about or when a parent asks "what has my child actually completed?" and you need a clean list.
Tab 5 - Profile Settings
The Profile Settings tab is where you maintain everything that powers the rest of the profile: basic info, academic goals, official scores, and accommodations.
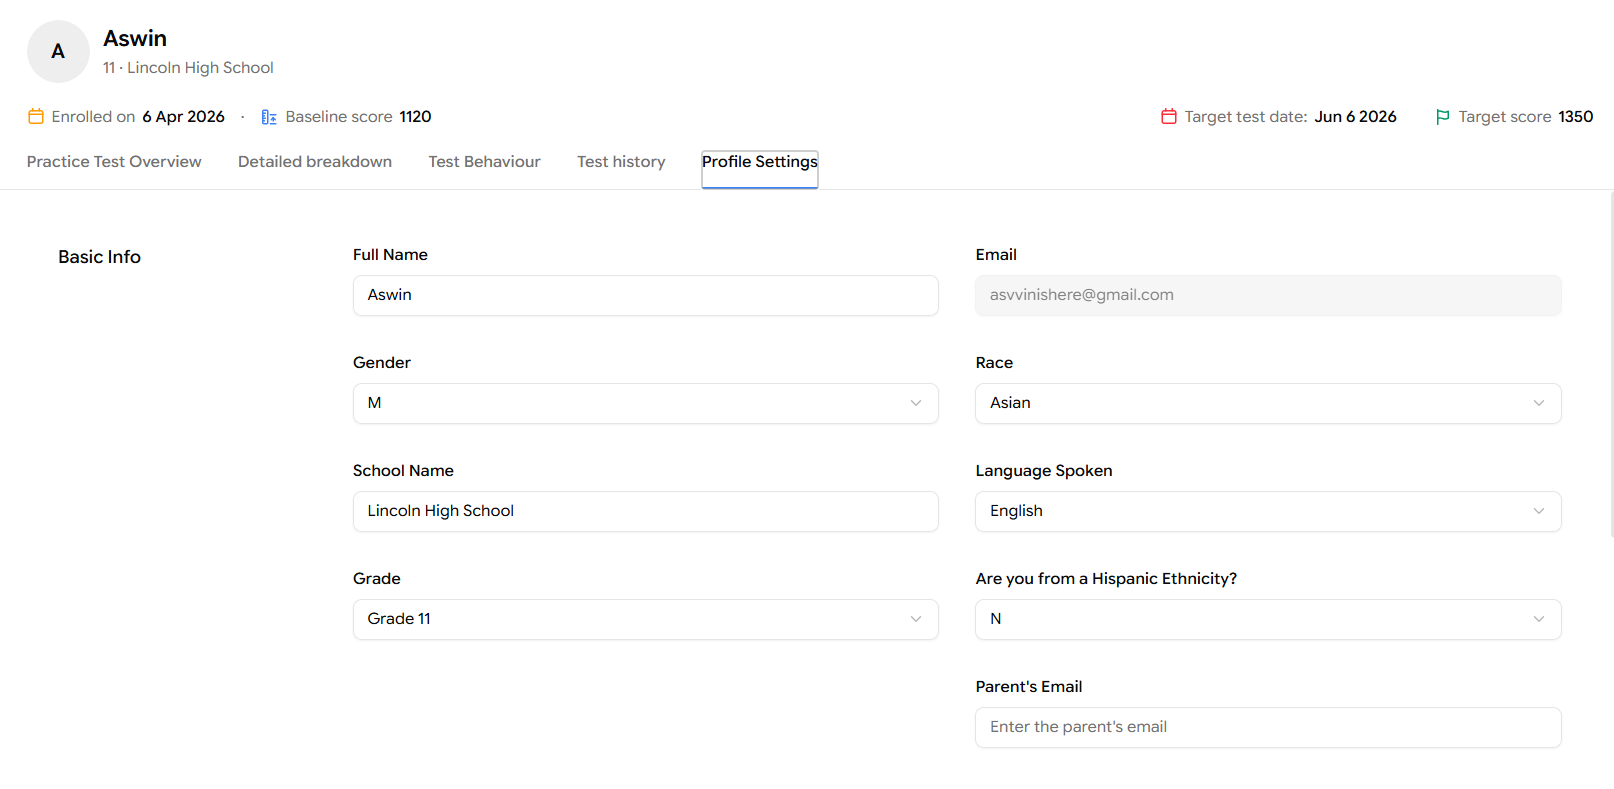
Basic Info covers personal and demographic fields:
Full Name and Email - identity and login.
Gender, Race, Hispanic Ethnicity, Language Spoken - demographic fields used in reporting.
School Name and Grade - used to group students and personalise communication.
Parent's Email - for sending parent-facing notifications and reports.
The Academic Goals section captures:
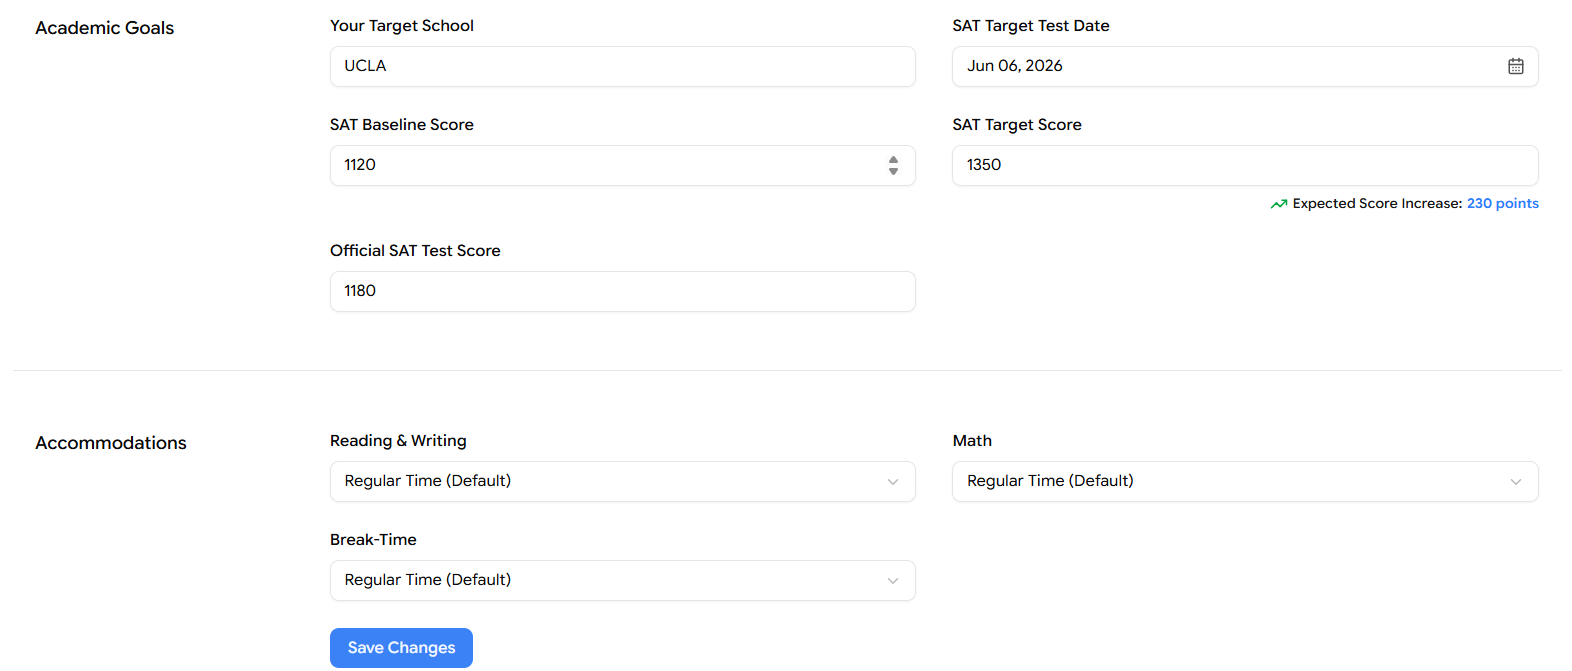
Your Target School - the college the student is aiming for.
SAT Target Test Date - when the student plans to take the official SAT.
SAT Baseline Score - where the student is starting from.
SAT Target Score - the goal score. Once both Baseline and Target are filled in, EdisonOS shows the Expected Score Increase in green (e.g., 230 points).
Official SAT Test Score - the score the student received on the official SAT, if they've taken it.
Fill in Academic Goals as early as possible
Almost every chart in the Student Profile uses these fields - the target flag on the Latest Test Score bar, the Expected Score Increase indicator, and milestone tracking in reports all depend on having a baseline and a target. Even rough estimates beat blank fields.
Accommodations
The Accommodations section sits at the bottom of the Profile Settings tab and is covered in detail in 7.5 Student Settings. The short version: three dropdowns (Reading & Writing, Math, Break-Time) let you grant extended time to students who qualify for it.
Conclusion
Used together, these tabs give you a 360° view of how a student is preparing, what they know, how they test, and how consistently they show up so you can plan the next session with precision.