9.3* Student Analytics
When you click View Report on any submitted test in the Reports section, the specific report's overview opens by default. It gives you a complete snapshot of a student's performance on a single test attempt.
Accessing a Report
Navigate to your program (e.g., SAT) → Reports. The table lists all test sessions with Student Name, Practice Test Name, Type, Started At, Submitted At, Time Taken, Raw Score, Score %, and Scaled Score.
Click View Report to open the detailed view.
Test Summary
The header shows the test name, type, student, timestamps, and assigner. Use Copy Link to share the report.
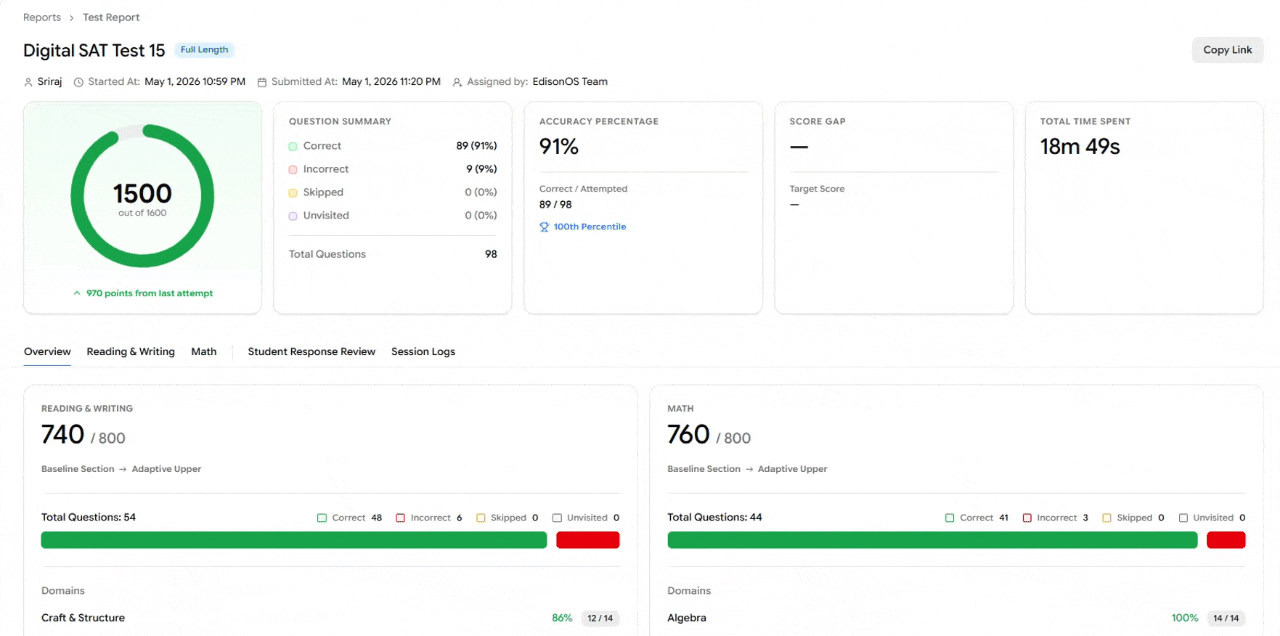
Five summary cards follow:
Total Score - Scaled score out of 1600, with progression from the last attempt.
Question Summary - Count and percentage of Correct, Incorrect, Skipped, and Unvisited questions.
Accuracy Percentage - Correct ÷ Attempted, plus the student's percentile.
Score Gap - Difference between current score and target score (if set).
Total Time Spent - Cumulative time on the test.
Section-Wise Performance
Performance is split into Reading & Writing and Math.
Each section card shows:
Scaled score out of 800
Adaptive path taken (e.g., Baseline Section → Adaptive Upper)
Question breakdown with a visual progress bar
Domain accuracy - Performance per content area (Craft & Structure, Algebra, etc.) with percentage and raw fraction.
Answer Changes
Tracks how the student revised answers during the attempt:
Correct to Incorrect - Often signals overthinking.
Incorrect to Correct - Effective review.
Incorrect to Incorrect - Suggests guessing or content gaps.
Performance by Difficulty
Expand Show Detailed Analytics to see score percentage across Easy, Medium, and Hard questions. Each card shows score, time spent, question breakdown, and answer-change patterns for that difficulty.
Useful for spotting patterns. e.g., a student scoring higher on Hard than Medium may be rushing through perceived-easy questions.
Performance by Time
Visualizes how time per question affects accuracy, grouped into pacing buckets:
Bucket | Label | Interpretation |
|---|---|---|
0–10s | Blind Guess | Too fast to read; panic or skip |
11–40s | Rushed | Speed-reading risk |
41–90s | Ideal | Strong performance zone |
91–150s | Deep Dive | Methodical; good for hard questions |
150s+ | Time Sink | May indicate difficulty |
This helps diagnose whether mistakes come from rushing, overthinking, or content gaps.
Reading & Writing / Math Overview
The Reading & Writing and Math tabs offer a deeper, section-specific breakdown of the student's performance. Both tabs follow the same layout.
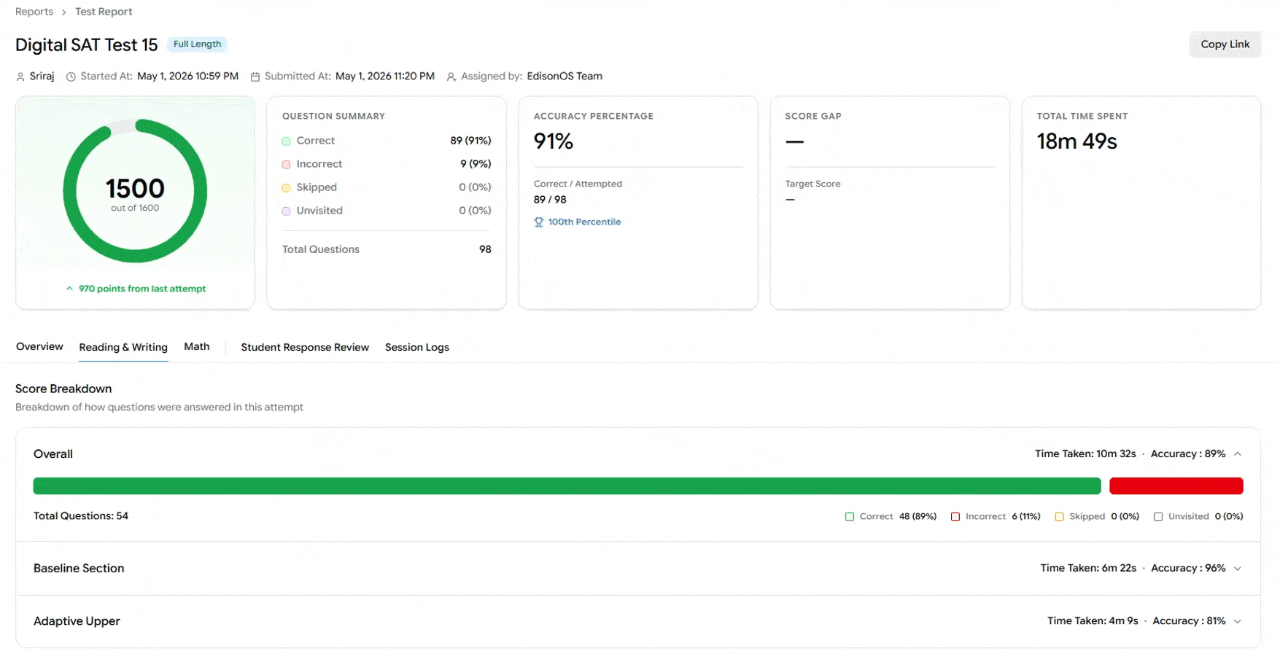
Score Breakdown
Shows how questions were answered in the attempt, split by:
Overall - Total questions, correct, incorrect, skipped, unvisited, with overall time taken and accuracy.
Baseline Section - Performance on the first (non-adaptive) module.
Adaptive Upper - Performance on the adaptive second module.
Each row displays time taken and accuracy, with an expandable arrow for further detail.
Performance by Difficulty
Breaks down performance across Easy, Medium, and Hard questions for this section. Each card shows:
Score percentage and raw fraction
Total time and average time per question
Correct / Incorrect / Skipped / Unvisited counts
Answer-change patterns (Correct→Incorrect, Incorrect→Correct, Incorrect→Incorrect)
Skill-Difficulty Heatmap
A granular view of performance by Domain → Skill across difficulty levels. Click any domain to expand its sub-skills.
Color-coded performance bands:
🟢 Strong — ≥ 80%
🟡 Needs Practice — 40%–79%
🔴 Needs Improvement — < 40%
Columns include All, Easy, Medium, and Hard, each showing percentage and raw fraction. Use the All Sections filter to scope by Baseline or Adaptive module.
This view is the fastest way to pinpoint exactly which skills need reinforcement and at which difficulty level.
Performance by Time
A per-question time chart plotting Time Spent (green/red bars for correct/incorrect) against Average Time (blue line) for every question in the section.
Toggle between two views in the top right:
Time Pacing Chart — Distribution view (grouped by pacing buckets)
Time Chart — Per-question detail (shown above)
Hover any bar to see the exact time spent vs. average. Spikes above the average line indicate questions where the student lingered; bars well below suggest rushing.
Student Response Review Tab
The Student Response Review tab shows how the student answered every question in the test.
Table View
Each row represents one question and includes:
# — Question number
Response — Student's selected option
Answer — Correct option
Module, Domain, Skill — Content classification
Type — Question format (e.g., Multiple Choice)
Difficulty — Easy / Medium / Hard
Time Spent
Tools Used — Any in-test tools the student accessed
Section Filter
Use the All Sections dropdown to scope responses to a specific module — Baseline or Adaptive, Reading & Writing or Math.
Detailed Question View
Toggle to the detailed view using the layout icons in the top right to inspect one question at a time.
The detailed view shows the full passage, question, all answer options, and clearly labels the Your Response and Correct Answer. Tags at the top show Module, Domain, Skill, Question Type, and Difficulty.
A Question Navigator on the right lets you jump to any question. Color coding indicates Correct, Incorrect, Skipped, or Unvisited.
Toolbar Icons
The icons above the Question Navigator control what's visible in the detailed view:
👁 Eye icon — Toggle the student's response on/off
✅ Tick icon — Toggle the correct answer on/off
💡 Bulb icon — Show the solution / explanation for the question
📝 Annotations icon — Show or hide any annotations the student made during the test
📊 Navigator icon — Show or hide the Question Navigator sidebar
⬛ Layout icons — Switch between table view and detailed (single-question) view
View Insights
Click View Insights above the question to see aggregate analytics for that specific question across all students:
Correct % — How often students answer this correctly
Avg. Time Spent
Correct to Incorrect — How often students change a right answer to a wrong one
Incorrect to Correct — How often students recover
Useful for identifying trap questions or commonly missed items.
Activity Log
Click Activity Log to see a timestamped trail of the student's behavior on this question — when they landed, every answer update, when they left, and how they navigated away.
Report Question
Use Report Question to flag content issues (typos, ambiguous wording, incorrect answer keys) for review.
Session Logs Tab
The Session Logs tab provides a complete activity trail for the test attempt — every action the student took, timestamped.
Filters
Click the Filters button to scope the log by event type. Eleven filters are available:
Session — Start, submit, pause, resume events
Section — Section transitions
Timer — Timer-related events
Connectivity — Network drops or reconnections
Integrity — Tab switches, focus loss, or other integrity flags
Annotations — Highlights or notes added during the test
Answer — Every answer selection and update
Review — Mark-for-review actions
Navigation — Question-to-question movement
Tools — Use of in-test tools (calculator, reference sheet, etc.)
Other — Miscellaneous events
The header shows total events captured and how many are currently shown based on active filters.
This log is invaluable for investigating integrity concerns, understanding pacing decisions, or reconstructing exactly how a session unfolded.