15.14 Report Overview
The Overview tab provides a complete summary of a student's test performance. It brings together the overall score, question statistics, section-wise performance, domain analysis, difficulty breakdown, pacing insights, and answer change information in a single view, helping you quickly understand how the student performed throughout the test.
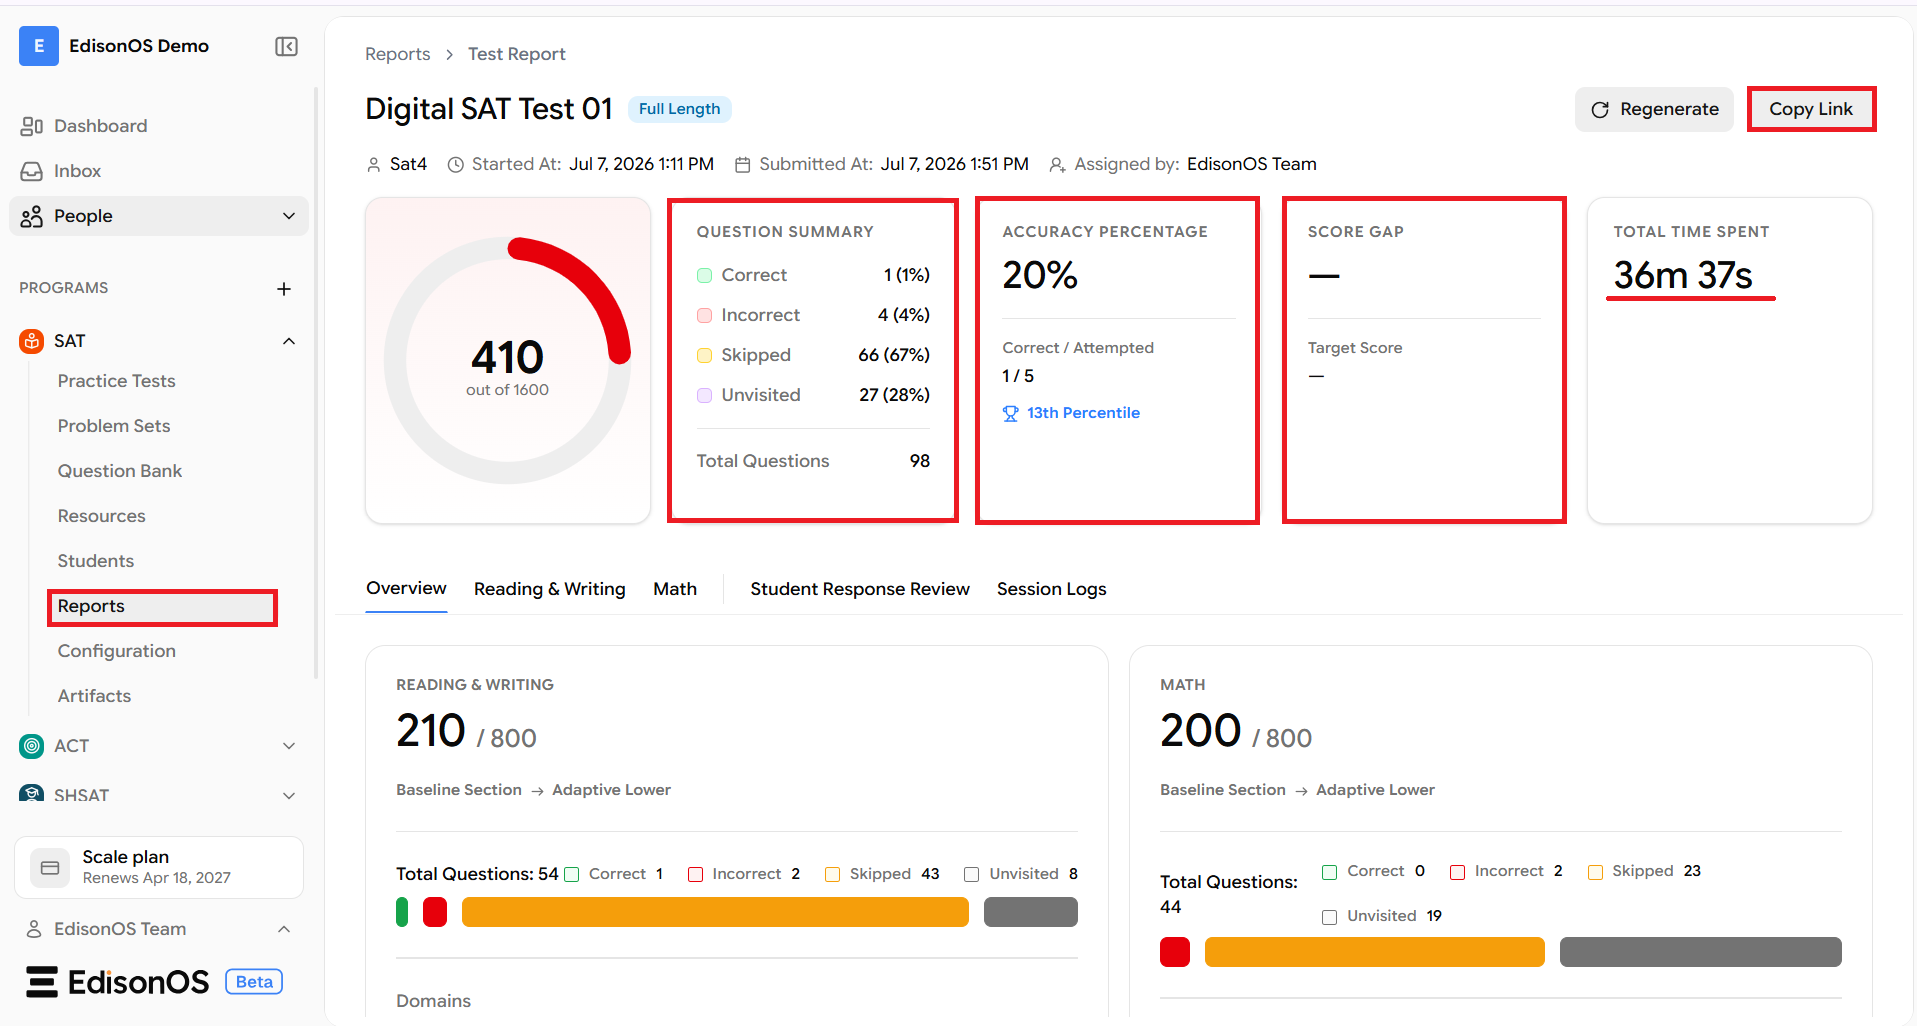
Test Information
At the top of the page, the report displays the basic details of the test, including:
Test name
Test type (such as Full Length)
Student name
Test start time
Test submission time
Assigned by information
The top-right corner also includes the following actions:
Regenerate – Refreshes the report using the latest available data.
Copy Link – Copies the report URL for sharing.
Overall Performance Summary
The first section provides a high-level overview of the student's performance.
It includes:
Overall Score showing the student's total score out of the maximum score.
Question Summary, which displays:
Correct questions
Incorrect questions
Skipped questions
Unvisited questions
Total number of questions
Accuracy Percentage, showing:
Overall accuracy
Correct vs. attempted questions
Percentile
Score Gap, displaying the difference between the student's score and the target score (when available).
Total Time Spent, showing the total duration taken to complete the test.
Navigation Tabs
Below the summary cards, the report is divided into multiple tabs:
Overview → Reading & Writing → Math → Student Response Review → Session Logs
The Overview tab combines the overall analytics from the entire test.
Section-wise Performance
The report displays separate performance cards for each test section.
Section score
Total possible score
Adaptive path information
Total questions in the section
Number of:
Correct questions
Incorrect questions
Skipped questions
Unvisited questions
A visual progress bar representing the question distribution.
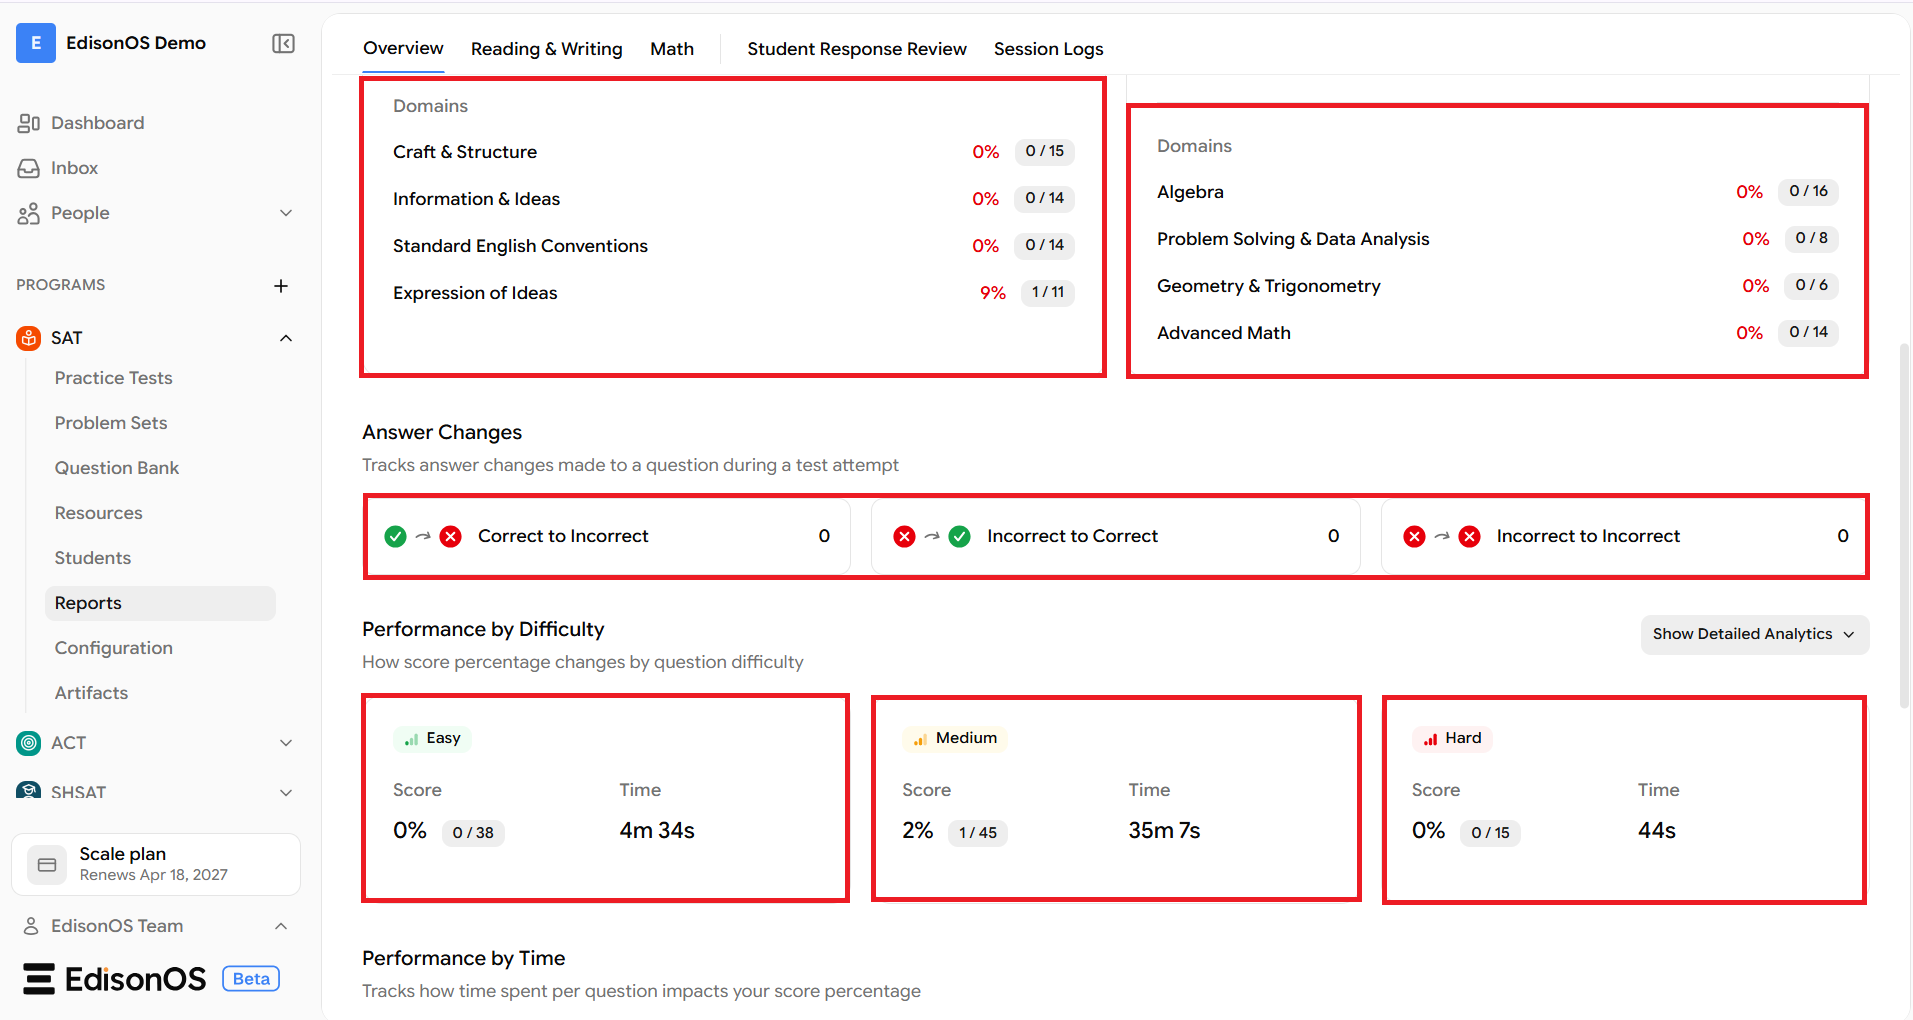
Domain-wise Performance
Within each section, the report breaks down performance by domain.
For every domain, it displays:
Domain name
Percentage score
Number of correct answers out of the total questions in that domain
This allows you to view performance across individual skill areas within each section.
Answer Changes
The Answer Changes section tracks how answers were modified during the test attempt.
It displays the number of questions that changed from:
Correct to Incorrect
Incorrect to Correct
Incorrect to Incorrect
Performance by Difficulty
This section groups questions based on their difficulty level.
The report displays separate cards for:
Easy
Medium
Hard
Each card shows:
Score percentage
Correct answers out of total questions
Total time spent on questions in that difficulty level
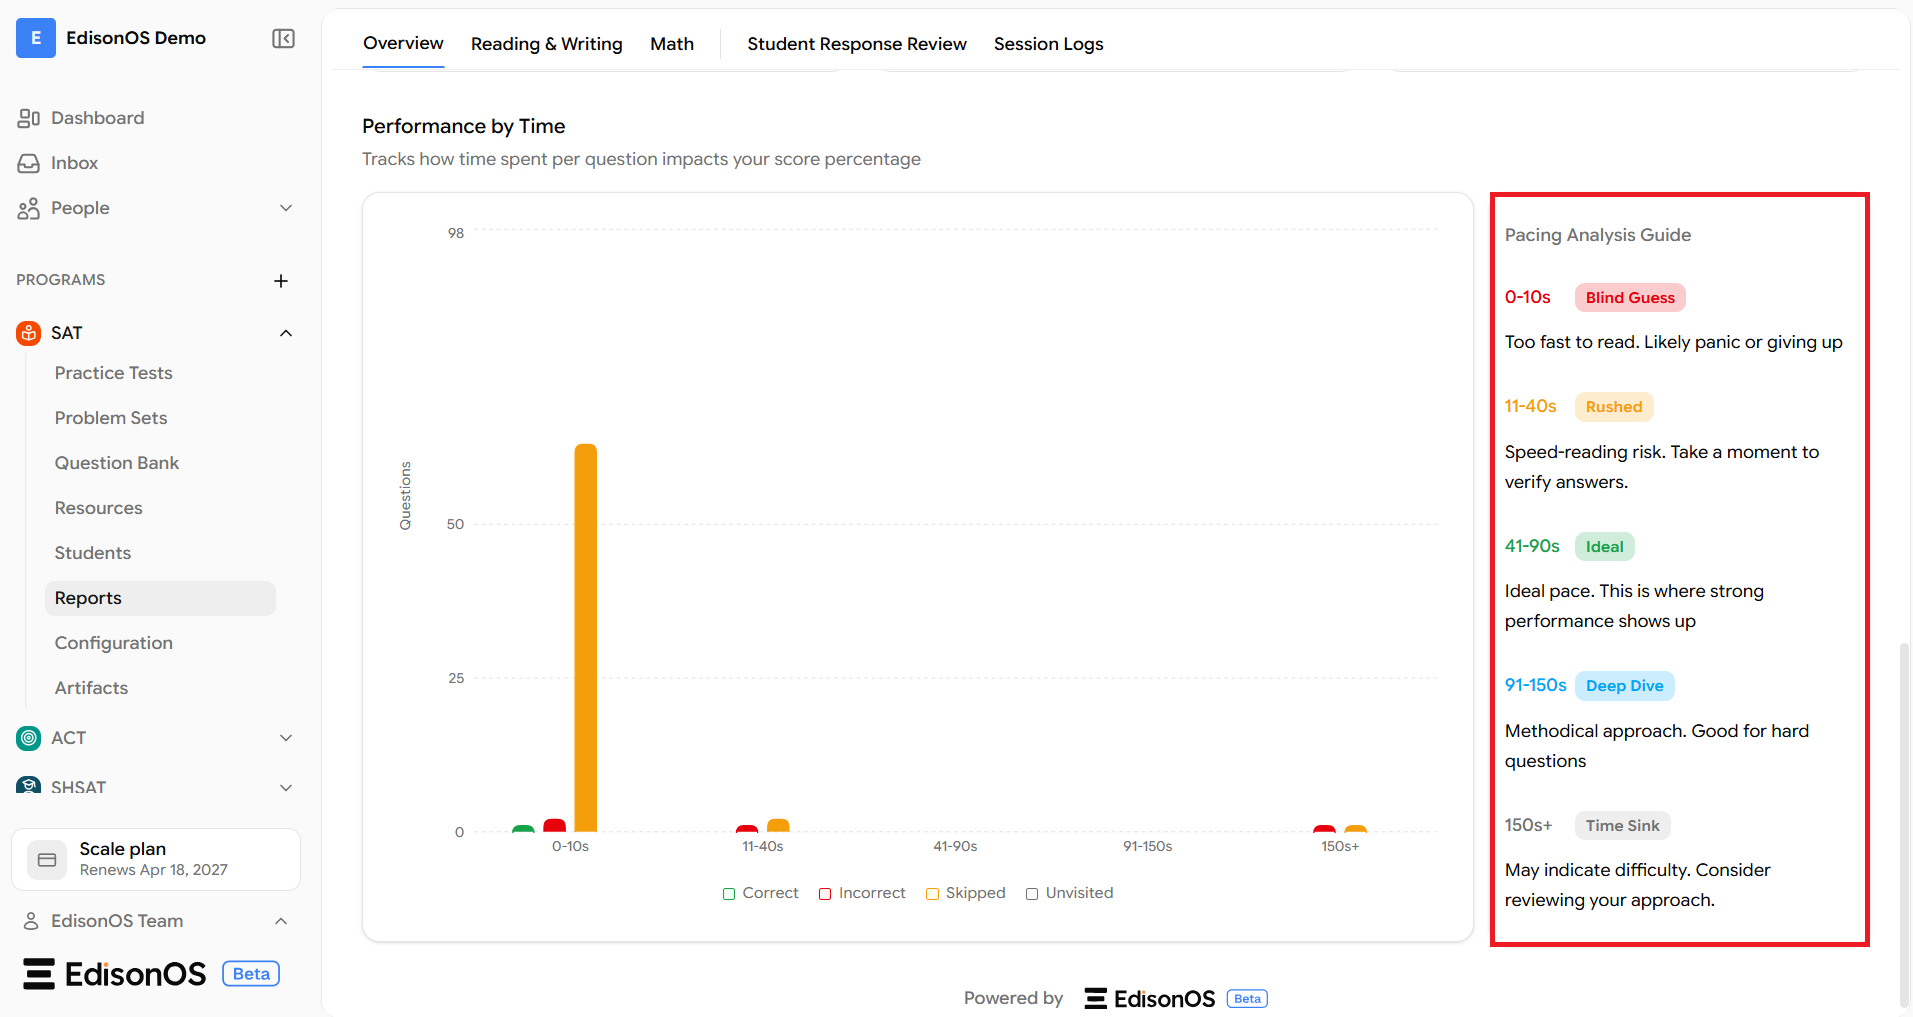
Performance by Time
The Performance by Time chart groups questions based on how long the student spent on them before answering or skipping.
The chart categorizes questions into different time ranges, such as:
0–10 seconds
11–40 seconds
41–90 seconds
91–150 seconds
150+ seconds
For each time range, the chart shows the number of:
Correct questions
Incorrect questions
Skipped questions
Unvisited questions
Pacing Analysis Guide
Alongside the timing chart, the report includes a Pacing Analysis Guide that explains each time category.
The guide labels each pacing range and provides a short description of what that pacing represents, helping interpret the student's time spent across different questions.
Reading & Writing Report
The Reading & Writing tab provides a detailed breakdown of the student's performance in the Reading & Writing section.
It includes section-wise score distribution, question statistics, performance by difficulty, skill-level analysis, and time-based insights to help evaluate the student's strengths and improvement areas.
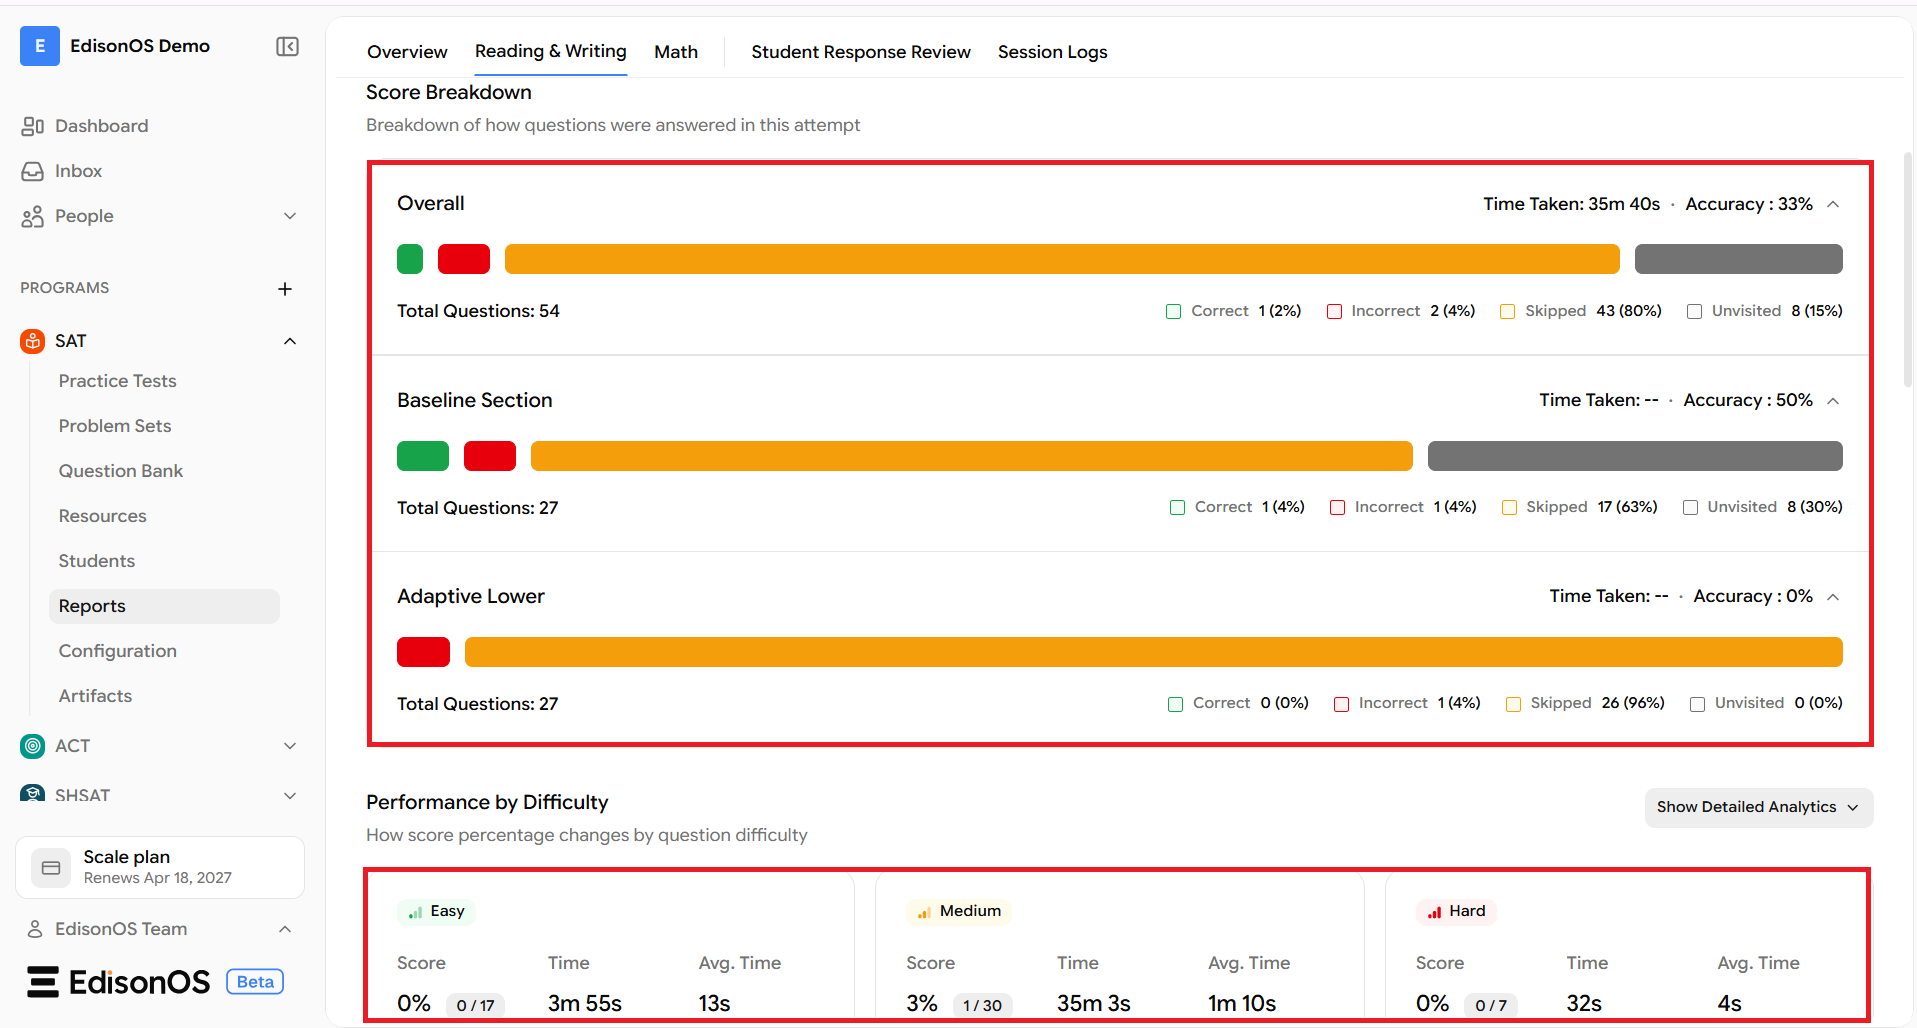
Score Breakdown
The Score Breakdown section summarizes the student's performance across the Reading & Writing section and its adaptive modules.
It includes:
Overall performance summary, showing:
Total questions
Number and percentage of Correct, Incorrect, Skipped, and Unvisited questions
Total time taken
Accuracy percentage
A visual progress bar representing the question distribution
Separate expandable summaries for:
Baseline Section
Adaptive Lower
Each module displays its own time taken, accuracy, and question distribution.
Performance by Difficulty
The Performance by Difficulty section categorizes questions based on their difficulty level.
Separate cards are displayed for:
Easy
Medium
Hard
Each difficulty card includes:
Score percentage
Correct answers out of total questions
Total time spent
Average time taken per question
The Show Detailed Analytics option provides additional difficulty-level insights.
Skill-Difficulty Heatmap
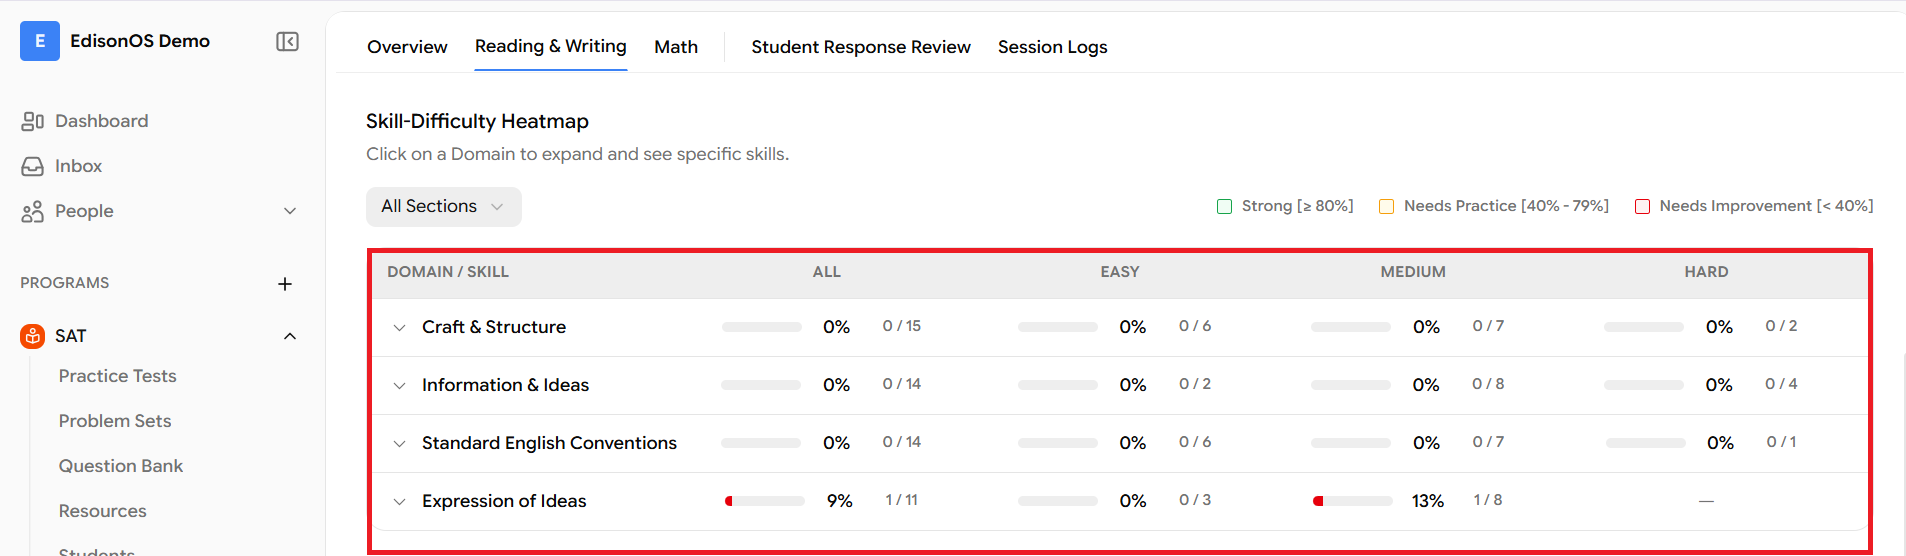
The Skill-Difficulty Heatmap provides a domain-wise performance summary across different difficulty levels.
A section filter allows you to switch between:
All Sections
Baseline Section
Adaptive Lower
For each domain, the table displays:
Overall performance
Easy question performance
Medium question performance
Hard question performance
Each difficulty column shows:
Score percentage
Correct answers out of total questions
A visual progress indicator
Performance is color-coded using the following indicators:
Strong (80% and above)
Needs Practice (40%–79%)
Needs Improvement (Below 40%)
Performance by Time
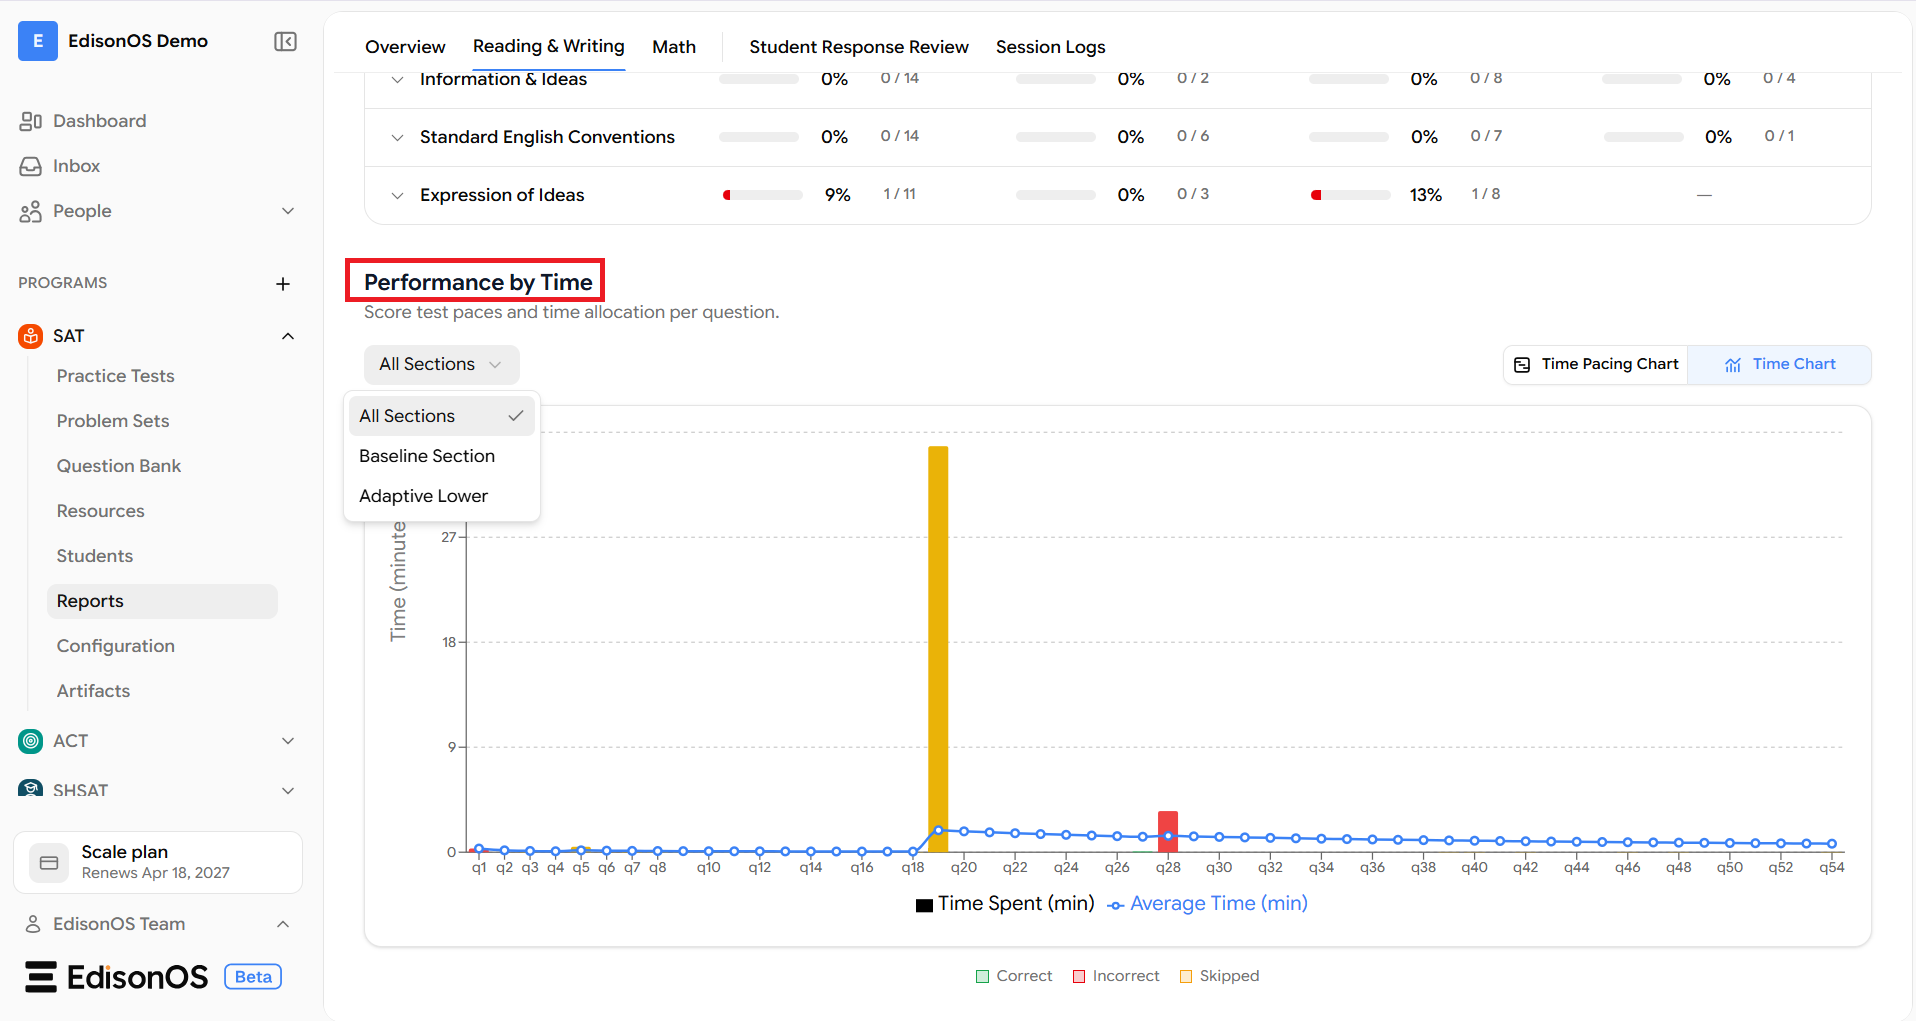
The Performance by Time section displays how the student spent time across questions in the Reading & Writing section.
A section filter allows you to view:
All Sections
Baseline Section
Adaptive Lower
The section also provides two visualization options:
Time Pacing Chart
Time Chart
These charts help analyze how time was distributed across questions throughout the Reading & Writing section.
The Math report follows the same structure as the Reading & Writing report. It includes the same analytics and performance insights, but the data is specific to the Math section.
Student Response Review Page
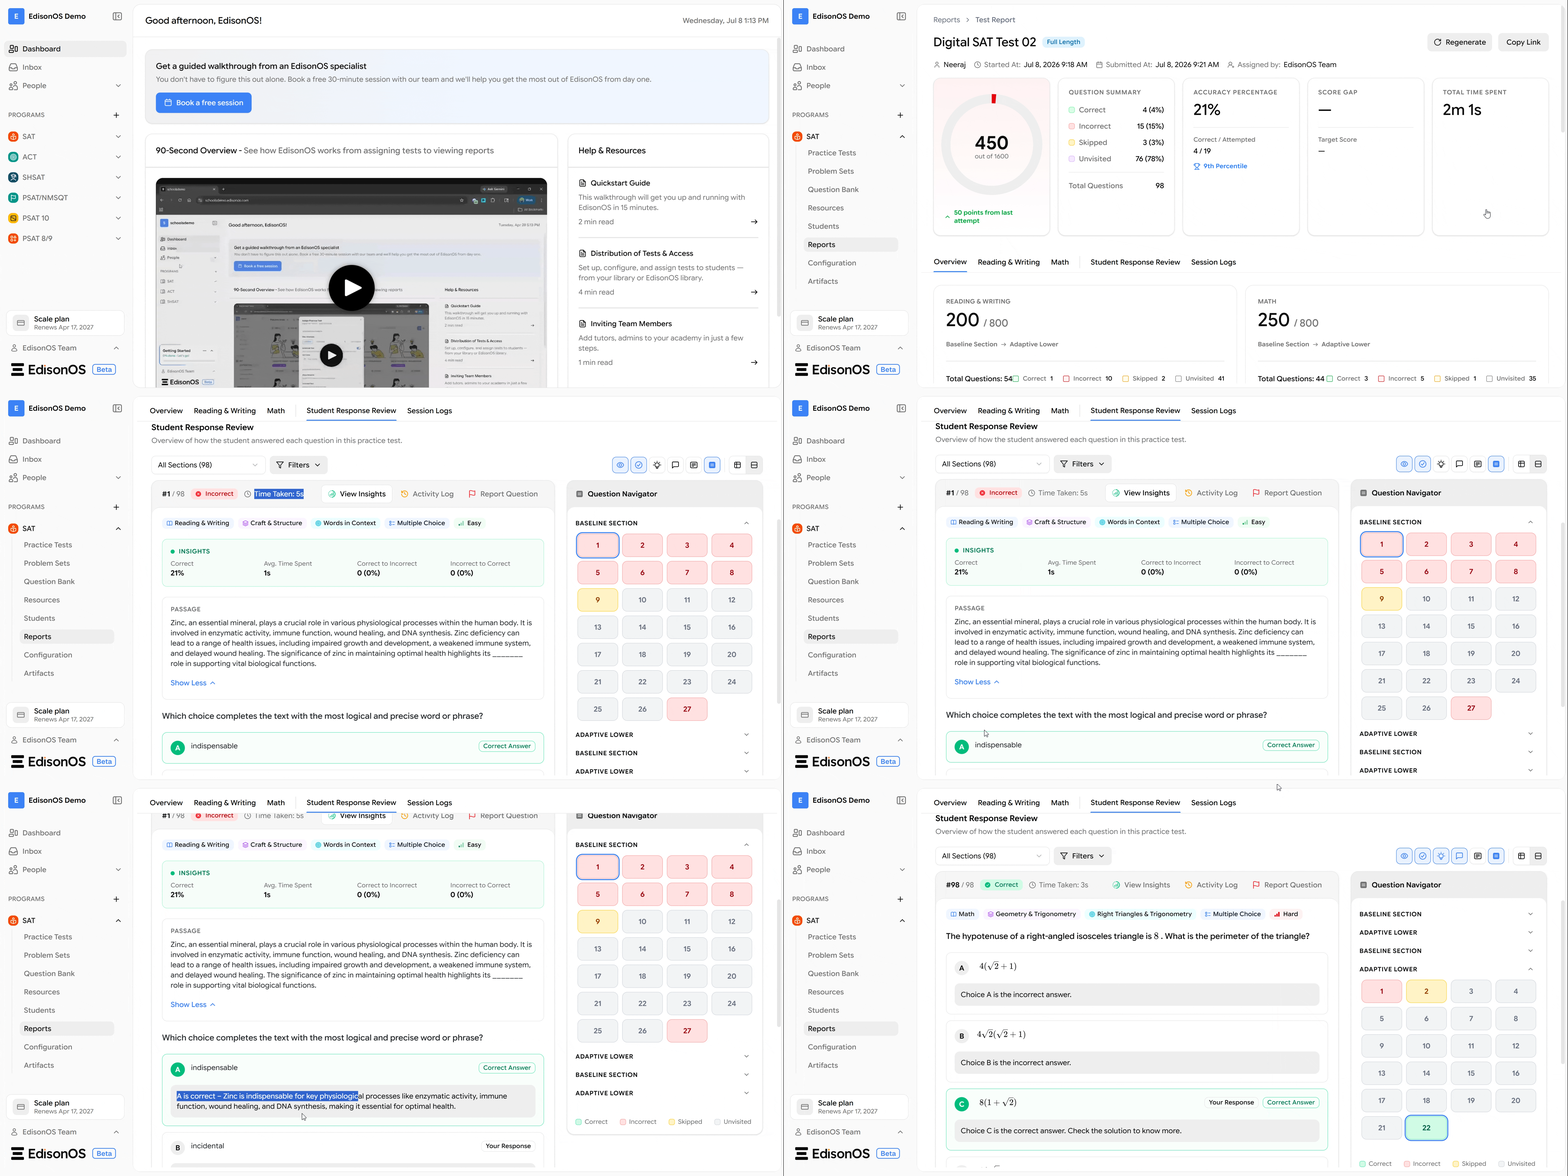
Displays an overview of how the student answered each question in the selected practice test.
Helps review individual question performance, answer accuracy, and response details.
Section & Filter Options
All Sections Dropdown – Allows switching between different test sections for review.
Filters – Filters questions based on available criteria.
Question Summary Header
Displays key information for the selected question:
Question Number – Current question being reviewed (e.g., 1 / 98).
Answer Status – Indicates whether the student's answer is correct or incorrect.
Time Taken – Shows how long the student spent on the question.
View Insights – Opens insights related to the student's performance.
Activity Log – Displays actions performed during the question.
Report Question – Option to report an issue with the question.
Question Information Tags
Each question includes tags describing its category:
Section – Identifies the test section (Reading & Writing).
Domain – Displays the content domain (Craft & Structure).
Skill – Shows the skill being assessed (Words in Context).
Question Type – Indicates the question format (Multiple Choice).
Difficulty Level – Displays the difficulty rating (Easy).
Tools Used
Shows the tools used by the student while answering the question.
Example displayed: Highlights & Notes.
Passage
Displays the reading passage associated with the question.
Provides the context required to answer the question.
Question Prompt
Displays the complete question that the student answered.
Answer Choices
Lists all available answer options.
Marks the student's selected response.
Identifies the correct answer.
Shows both selected and correct answers for comparison.
Question Navigator
Provides quick navigation between questions.
Features include:
Displays question numbers.
Group questions by test sections.
Highlights the currently selected question.
Uses color indicators to show question status.
Allows direct navigation to any question.
View Controls
Provides display options for reviewing responses using multiple view icons available at the top of the Question Navigator panel.
Section-wise Response Review
The Student Response Review page is organized into sections such as Adaptive Lower and Baseline Section.
Users can select a section by expanding it using the dropdown arrow.
After selecting a section, they can view the corresponding response report for that section.
Status Legend
The page includes a Status Legend that helps users identify the status of each question using color indicators.
Correct – Indicates that the student answered the question correctly.
Incorrect – Indicates that the student's answer is incorrect.
Skipped – Indicates that the student skipped the question without submitting an answer.
Unvisited – Indicates that the student did not open or visit the question during the assessment.
Student Response Review Options
Student Response – Displays the answer selected by the student.
Correct Answer – Shows the correct answer for the question.
Solution – Provides the explanation for the correct answer.
Feedback – Displays comments about the student's response.
Annotation – Allows users to view or add notes to the question.
Question Navigator – Displays all question numbers and their status for easy navigation.
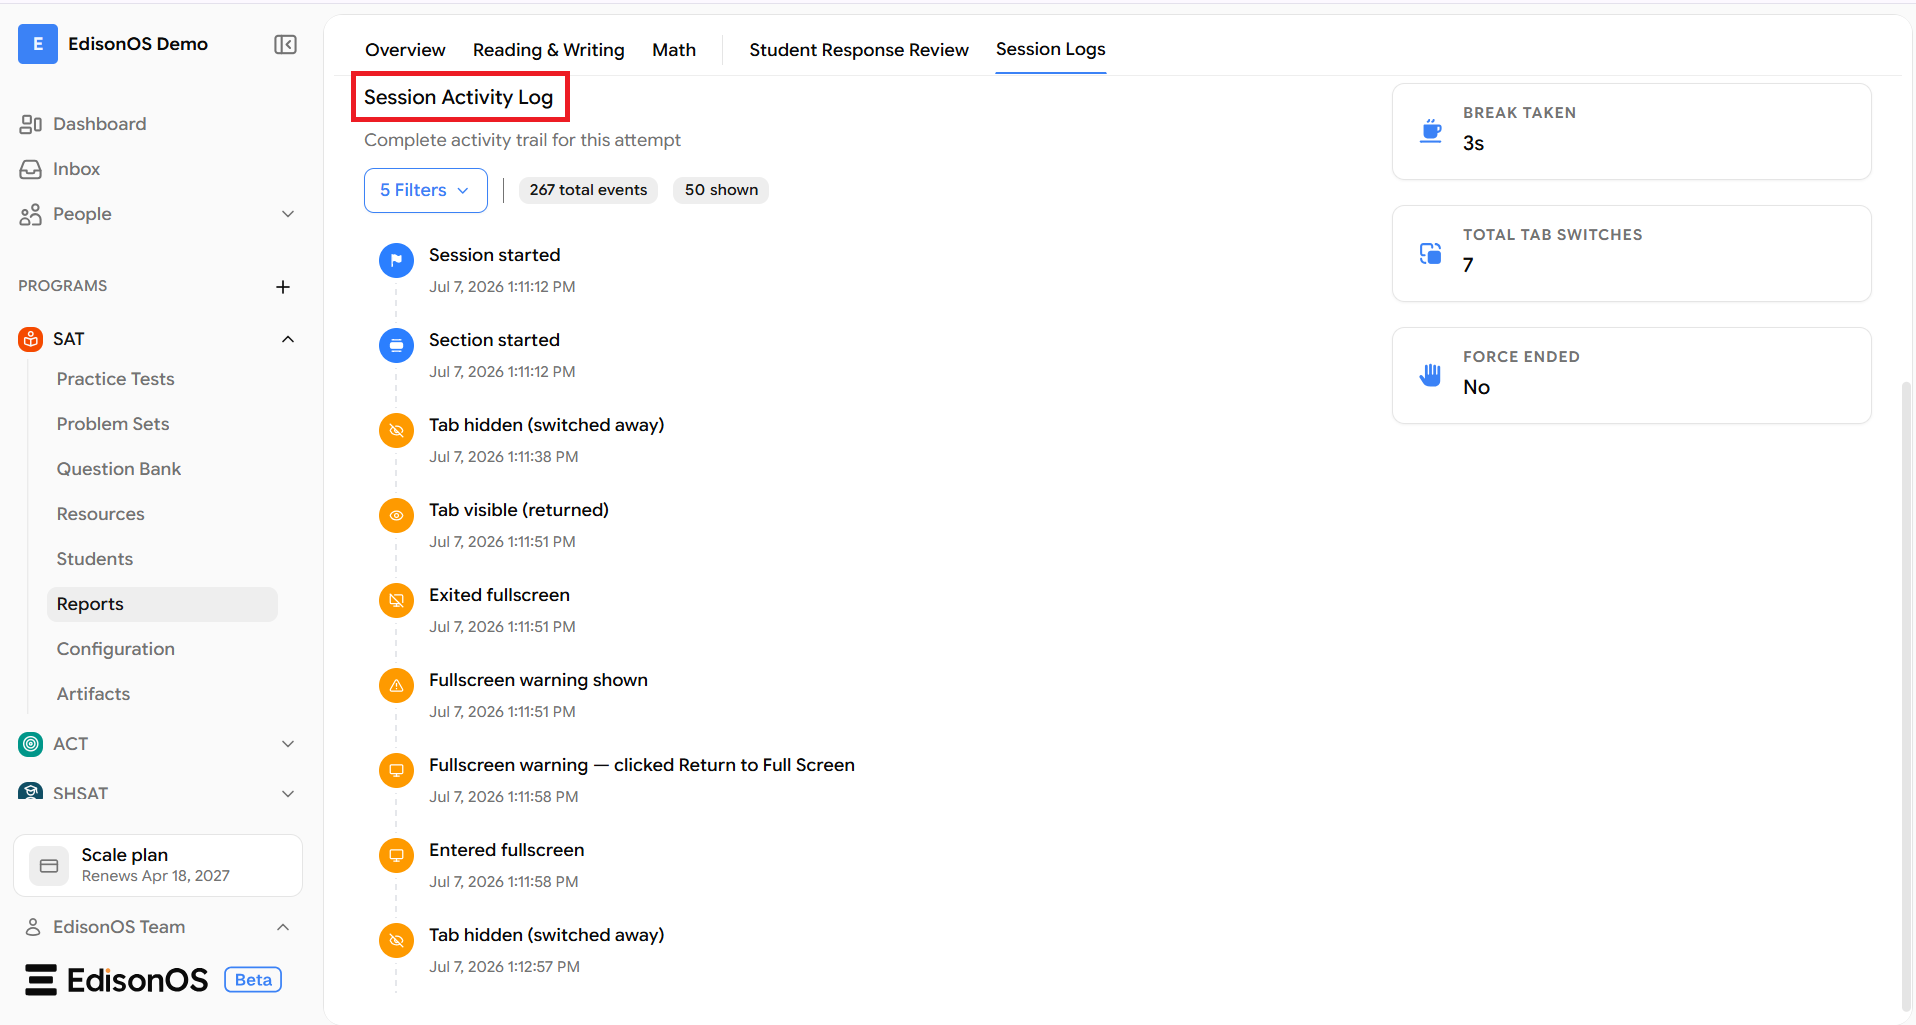
Session Logs Features
Session Activity Log – Displays a timeline of all activities performed during the test session.
Filters – Allows users to filter session events based on specific criteria.
Break Taken – Shows the total break duration during the test.
Total Tab Switches – Displays the number of times the user switched to another browser tab.
Force Ended – Indicates whether the test session was forcefully ended.
Event Timeline – Shows each session event along with its date and time.
Session Started – Displays the date and time when the test session began.
Section Started – Shows when each test section was started.
Tab Activity – Records events such as tab hidden (switched away) and tab visible (returned).
Fullscreen Activity – Displays events related to entering, exiting, and returning to fullscreen mode.