15.15 Domain-Level Performance Overview
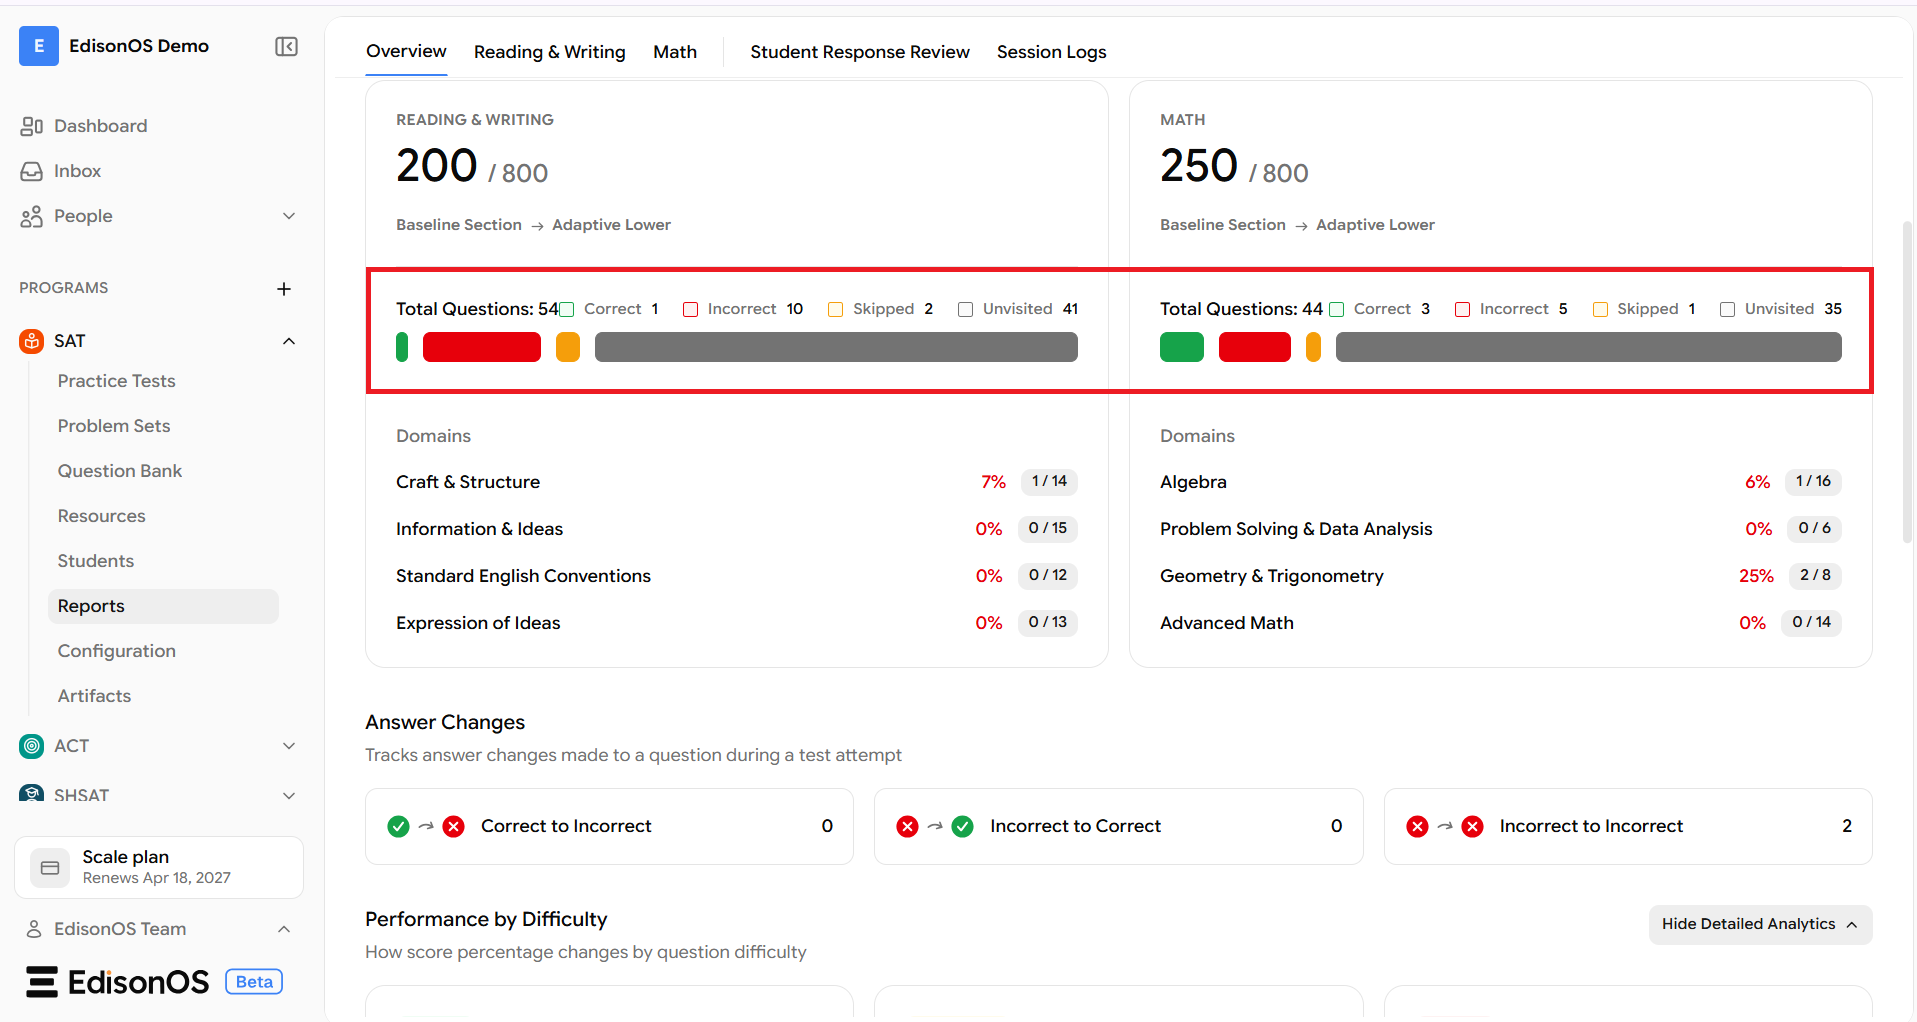
1. Exploring Domain Performance
The Domain Performance section breaks down your test results by individual skill areas. Instead of only showing your overall score, it helps you understand which concepts you performed well in and which areas need additional practice.
Each domain displays the percentage of correct answers along with the number of correctly answered questions out of the total questions from that domain.
Reading & Writing Domains
The Reading & Writing section is divided into four domains:
1. Craft & Structure
Measures your ability to interpret vocabulary in context, analyze text structure, and evaluate how authors organize ideas.
2. Information & Ideas
Evaluates your ability to locate evidence, interpret information, and draw conclusions from passages.
3. Standard English Conventions
Assess your understanding of grammar, punctuation, sentence structure, and standard English usage.
4. Expression of Ideas
Measures how effectively you improve the clarity, organization, and flow of written passages.
Each domain displays:
Accuracy percentage
Correct answers
Total questions in that domain
For example, 1/11 indicates that 1 question was answered correctly out of 11 questions in that domain.
Math Domains
The Math section is divided into four domains:
1. Algebra
Questions focused on equations, expressions, and linear relationships.
2. Problem Solving & Data Analysis
Measures your ability to interpret data, solve real-world problems, and analyze quantitative information.
3. Geometry & Trigonometry
Assesses concepts related to shapes, angles, circles, triangles, and trigonometric relationships.
4. Advanced Math
Evaluates higher-level algebraic concepts, functions, nonlinear equations, and equivalent expressions.
Like Reading & Writing, each domain displays:
Accuracy percentage
Correct answers
Total questions
How to Use Domain Performance
Review your domain-wise performance to identify strengths and areas for improvement.
For example:
Low performance in Algebra suggests spending more time practicing algebraic concepts.
Strong performance in Information & Ideas indicates a solid understanding of reading comprehension skills.
Using domain-level insights allows you to focus your preparation on the topics that will have the greatest impact on future test performance.
2. Understanding Performance by Difficulty
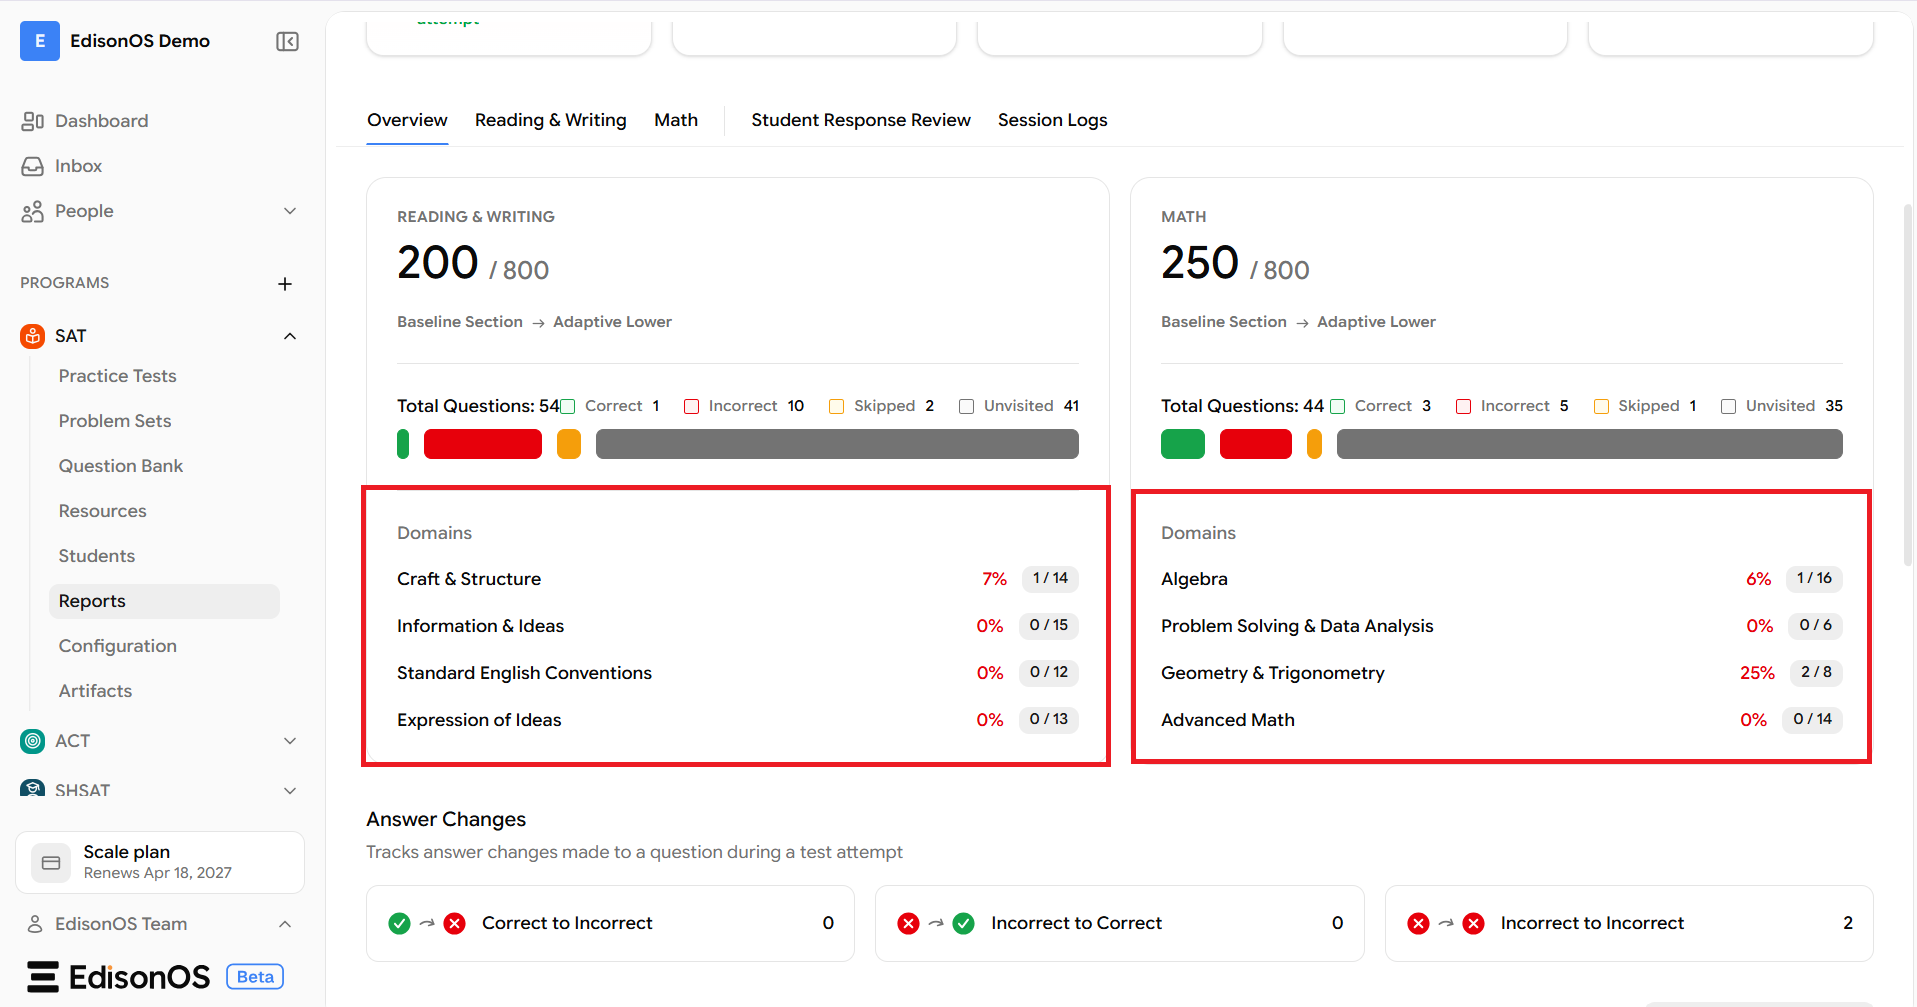
The Performance by Difficulty section shows how you performed across different question difficulty levels. It helps you understand whether you perform consistently on easier questions or need additional practice with more challenging problems.
Questions are grouped into three difficulty levels:
Easy
Medium
Hard
Each difficulty card displays:
Score Percentage
Correct Answers
Total Questions
Time Spent
Difficulty Levels
Easy
Represents foundational questions that test fundamental concepts.
A high score in this category indicates strong understanding of core concepts.
Medium
Includes questions that require additional reasoning and application of concepts.
Consistent performance here generally indicates readiness for more advanced questions.
Hard
Contains the most challenging questions in the test.
Performance in this category helps identify readiness for higher-level problem solving and complex reasoning.
Time Spent
Each difficulty level also displays the total time spent answering questions within that category.
Comparing your score with the time spent can help determine whether you are managing your time effectively.
Using Difficulty Analysis
Use this section to:
Identify which difficulty level requires additional practice.
Compare accuracy across Easy, Medium, and Hard questions.
Balance both speed and accuracy during future attempts.
3. Understanding Performance by Time & Pacing Analysis
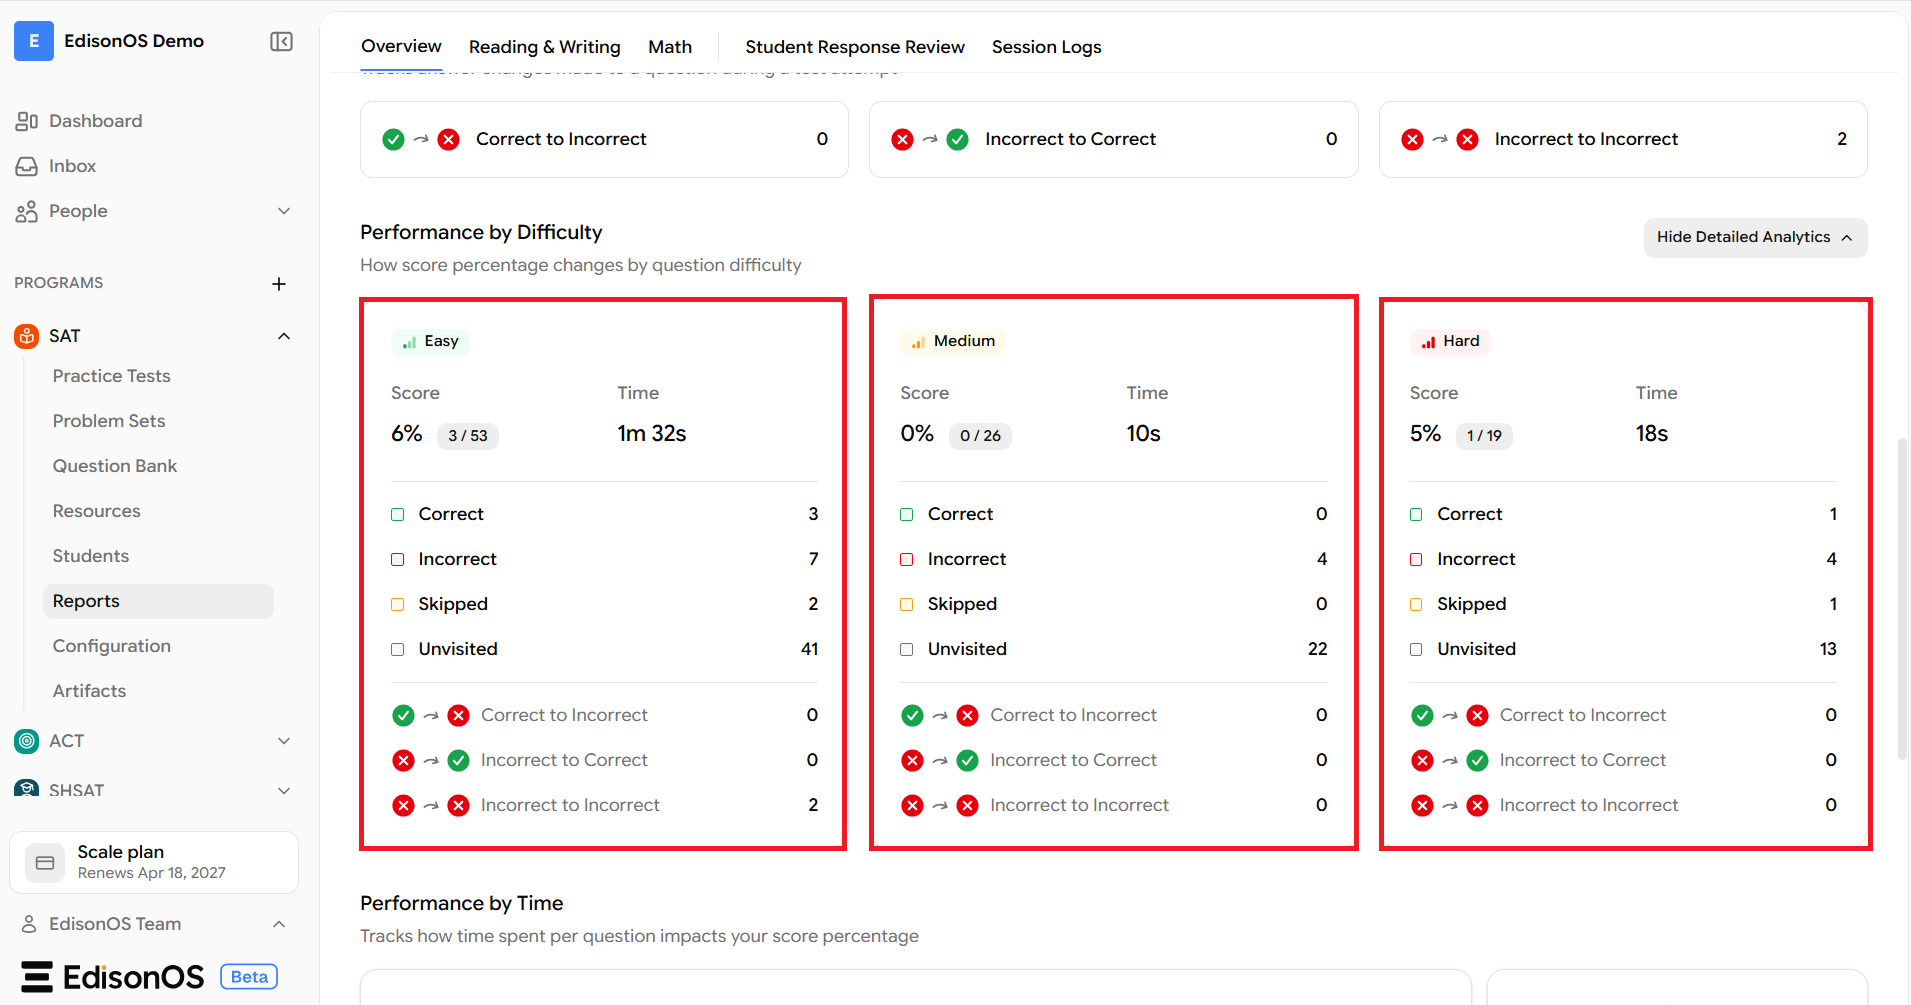
The Performance by Time section shows how the amount of time spent on each question relates to your performance.
Questions are grouped into different time ranges based on how quickly they were answered.
The graph displays the number of:
Correct answers
Incorrect answers
Skipped questions
Unvisited questions
for each time range.
Pacing Categories
0–10 Seconds — Blind Guess
Questions answered within this range are typically completed too quickly to allow for careful reading.
This may indicate guessing or rushing through questions.
11–40 Seconds — Rushed
Questions answered within this range may have been completed before fully reviewing the available information.
Students should ensure they have read the question carefully before submitting an answer.
41–90 Seconds — Ideal
This is considered the recommended pace for most questions.
Maintaining this pace allows sufficient time to understand the question while keeping overall test progress on track.
91–150 Seconds — Deep Dive
Spending additional time may be appropriate for more challenging questions that require deeper analysis.
However, consistently remaining in this range may reduce the time available for later questions.
150+ Seconds — Time Sink
Questions taking longer than 150 seconds may indicate difficulty with the concept or excessive time spent on a single question.
If you become stuck, consider moving on and returning later if time permits.
Using Pacing Analysis
Review this section after each test to determine whether your timing strategy supports consistent performance.
Balancing speed with accuracy can help improve both question completion and overall scores.
4. Understanding Question Summary & Accuracy
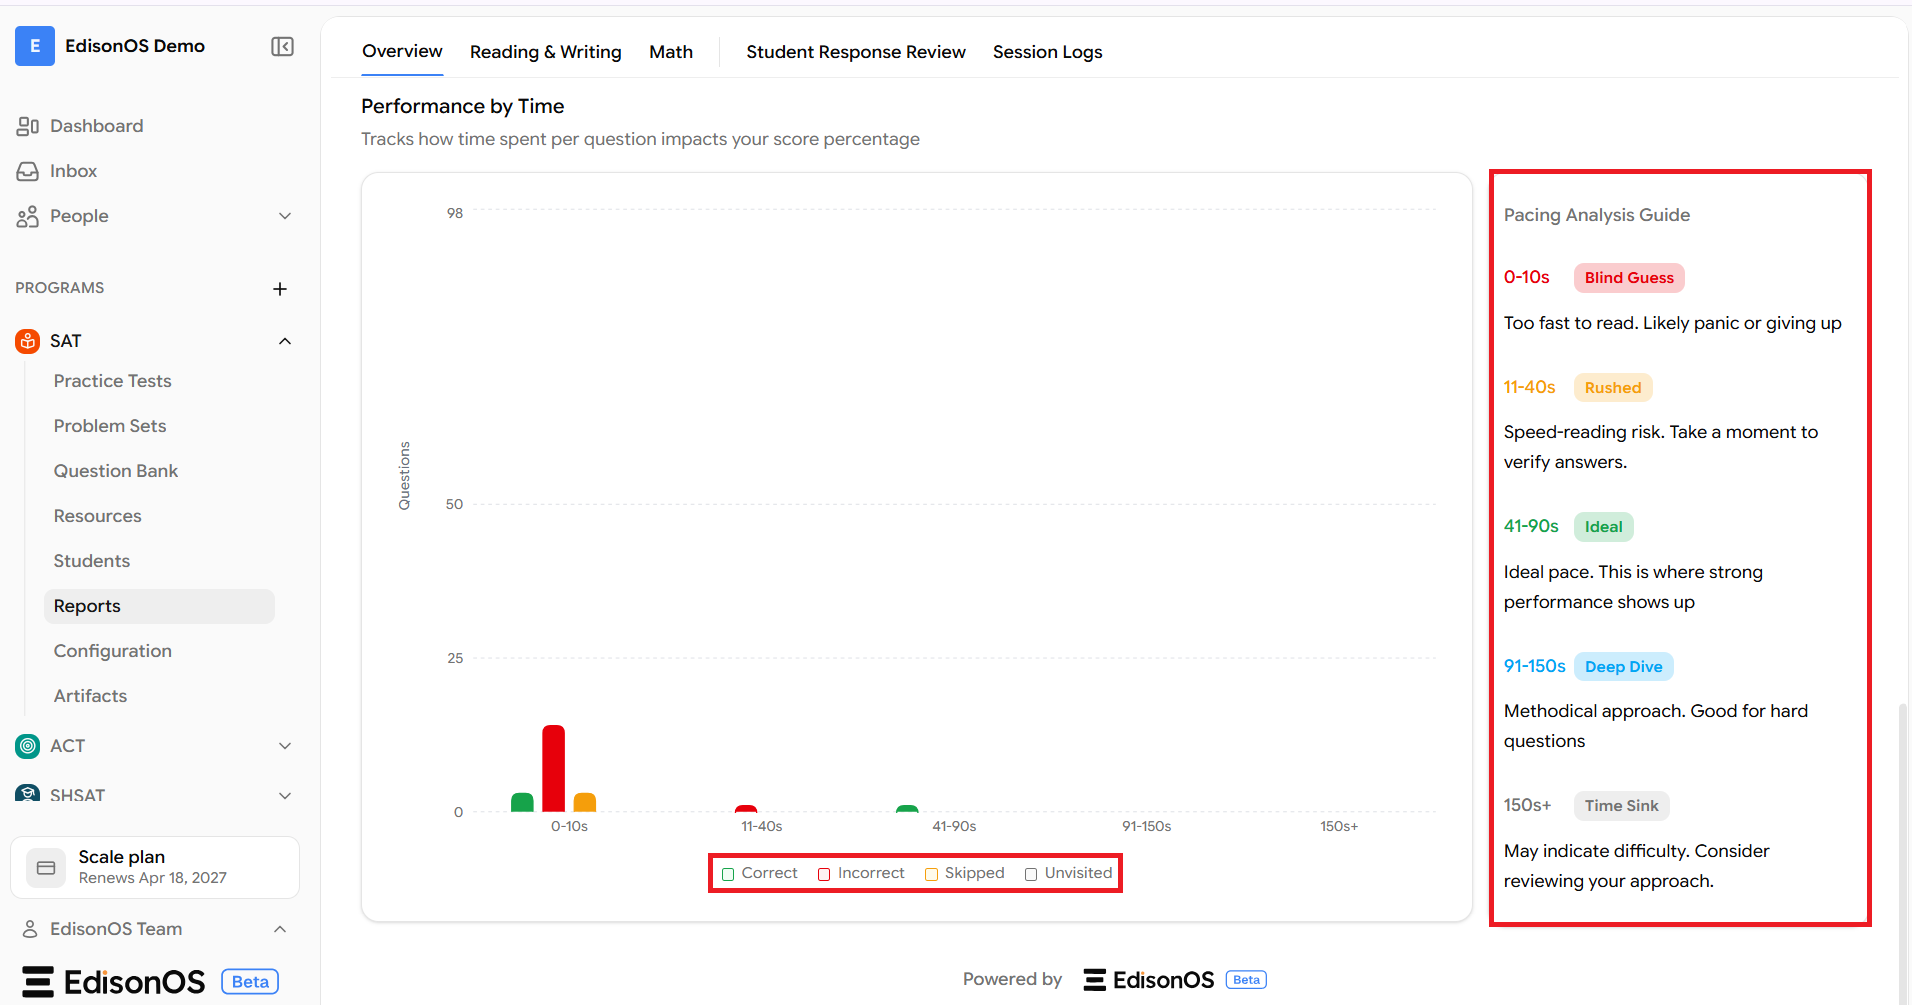
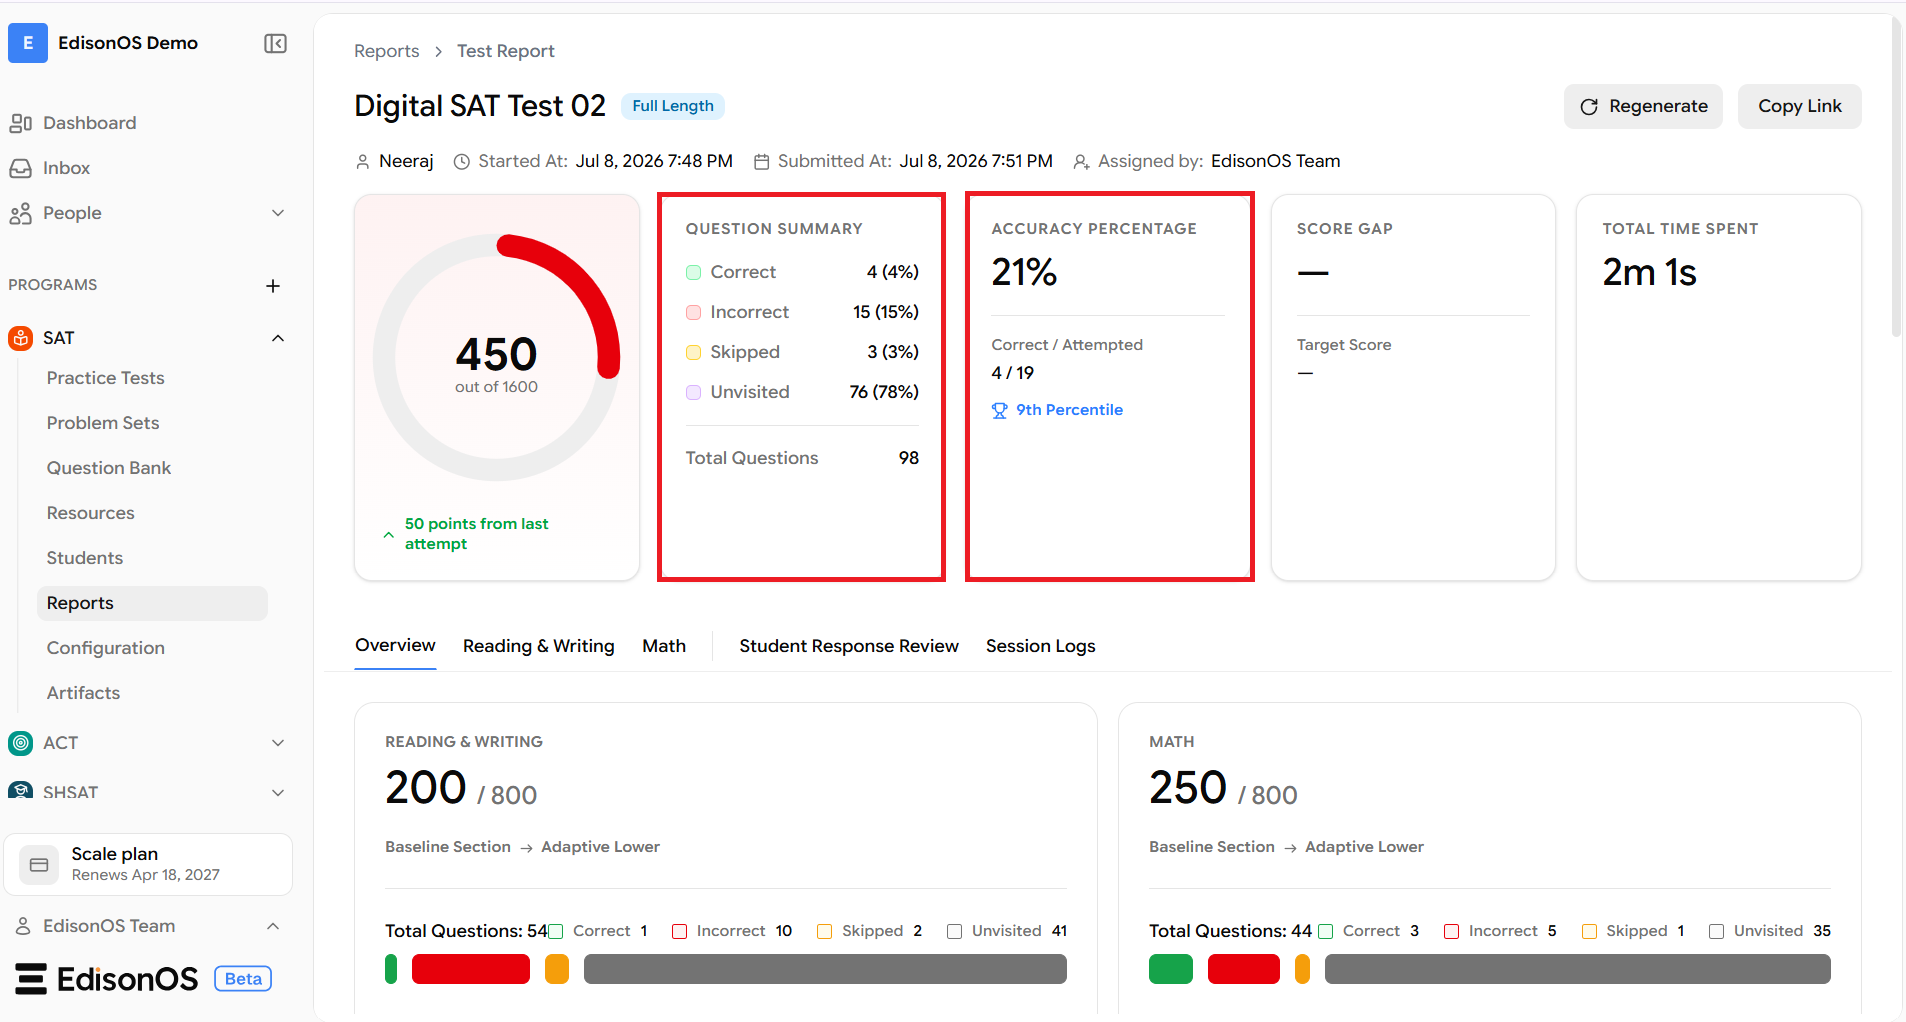
The Question Summary and Accuracy Percentage cards provide a quick overview of your overall test performance.
Together, these metrics help you understand how many questions you attempted and how accurately you answered them.
Question Summary
The Question Summary categorizes every question in the test into one of four statuses.
Correct
Questions that are answered correctly.
Incorrect
Questions that were attempted but answered incorrectly.
Skipped
Questions that were intentionally skipped during the test.
Unvisited
Questions that were never opened before the test ended.
The card also displays the Total Questions included in the test.
Accuracy Percentage
Accuracy Percentage measures how accurately you answered the questions you attempted.
It is calculated using:
Accuracy = (Correct Answers ÷ Attempted Questions) × 100
Skipped and unvisited questions are not included in this calculation because they were not answered.
The card also displays:
Correct / Attempted count
Percentile ranking (when available)
Using These Metrics
Reviewing Question Summary together with Accuracy helps you determine whether score improvements should come from:
Attempting more questions
Reducing incorrect answers
Managing time more effectively
5. Understanding Reading & Writing and Math Performance
The Reading & Writing and Math performance cards provide a section-wise breakdown of your test results.
Each card displays the section score, adaptive module progression, and question distribution.
Section Score
Each section displays the score earned out of the maximum available score.
For example:
Reading & Writing: 210 / 800
Math: 200 / 800
Adaptive Module Progression
The SAT uses an adaptive testing format.
Each section displays the modules completed during the test, such as:
Baseline Section
Adaptive Module
The adaptive module reflects the second stage of the assessment based on earlier performance.
Question Distribution
Each section displays the number of:
Correct questions
Incorrect questions
Skipped questions
Unvisited questions
A colored progress bar provides a visual summary of the distribution.